


The BEL20 Index is correcting the cycle up from the 2009 lows.
Firstly the BEL20 Index has trended higher with other world indices since the benchmark was established. The index remained in a long term bullish trend cycle into the May 2007 highs. From there it made a sharp correction lower that lasted until March 2009 similar to other world indices. That is where the index corrected the whole long term bullish cycle from the all time lows. At this point is where this bullish trend, cycle and swing analysis begins. The analysis continues below the monthly chart.
BEL20 Monthly Chart
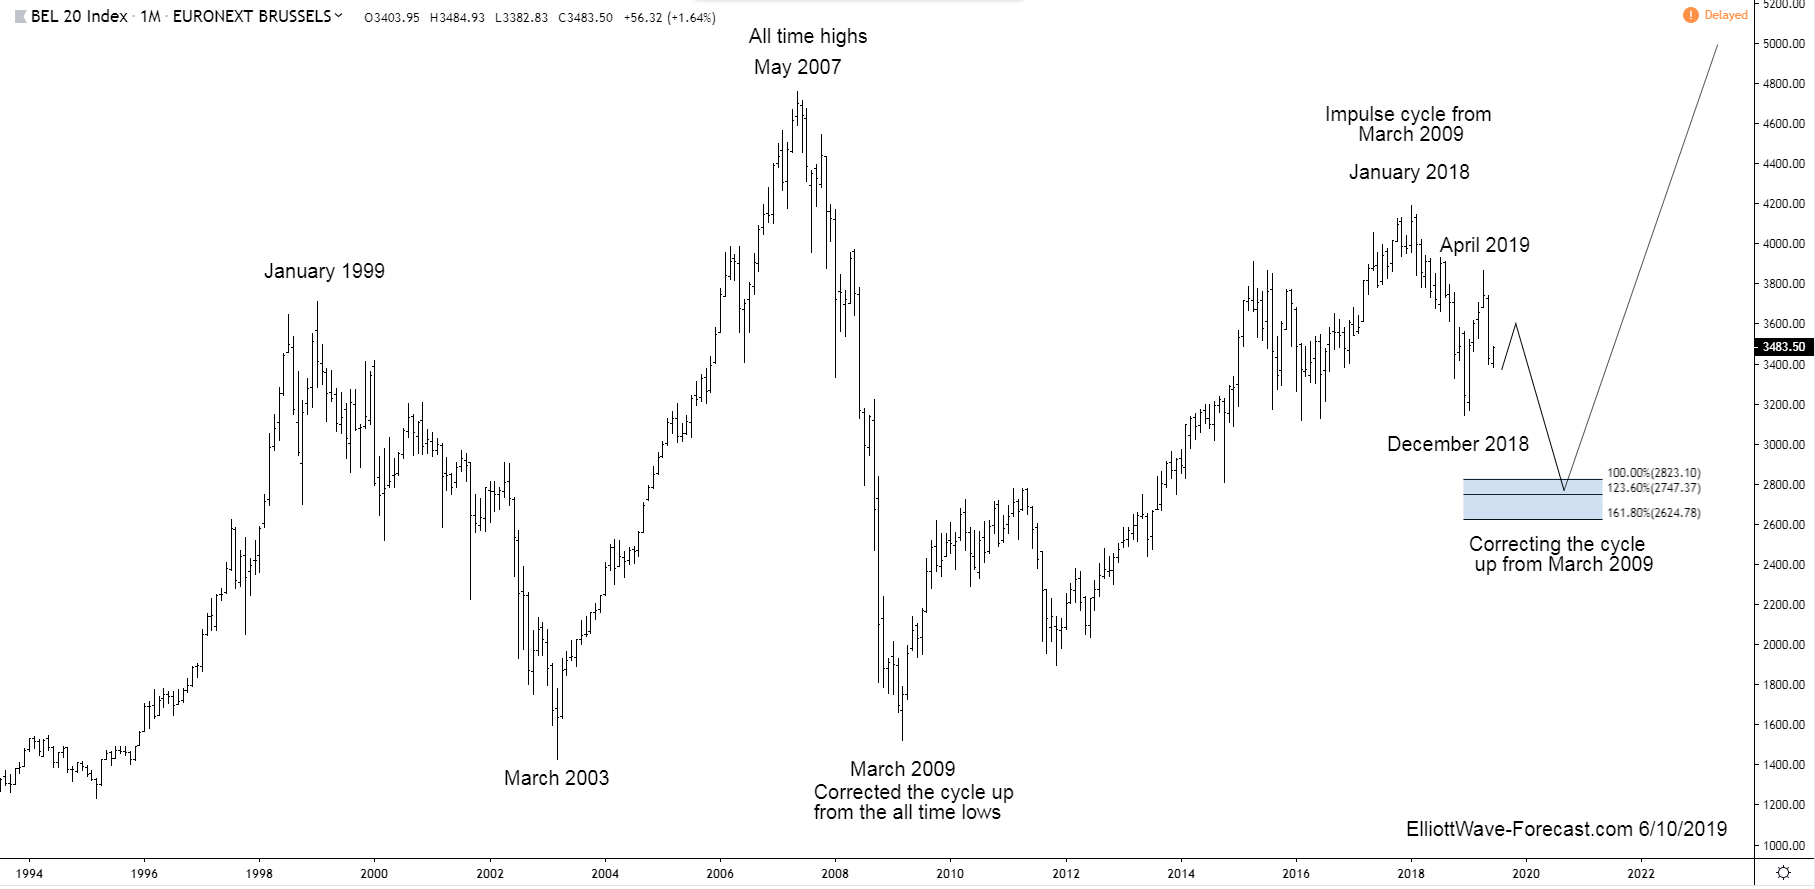
Secondly, the 2009 lows corrected the whole longer term cycle higher from inception in the benchmark index. The bounce from the March 2009 lows into the January 2018 highs was a clear five swing impulse. The pullback lower from that high is strong enough to suggest it is correcting the whole cycle up from the March 2009 lows. This is determined by reading the RSI and other momentum indicators.
Thirdly, previously mentioned earlier, the pullback from the January 2018 high to the December 2018 lows was strong enough to suggest it is correcting the cycle up from the March 2009 lows.At this point the index could have possibly completed a corrective sequence against the uptrend however some related instruments suggest an otherwise deeper pullback. This pullback Fibonacci extension area shown on the chart is measured by the following. Take the Fibonacci extension tool on a charting platform and use January 2018 high as point one. Go down from there to the low of December 2018 as point two. From there make the point three at the April 2019 highs which gives the Fibonacci extension target area shown.
In conclusion, this double three correction is a typical and common Elliott Wave corrective structure. Previously mentioned earlier, this is correcting the cycle from the 2009 low. At this point in time the preferred view is while bounces fail below the April 2019 highs the index can see some further weakness toward the shown extension area. Afterward it can resume the longer term bullish trend.
Thanks for looking and feel free to come visit our website.
Lewis Jones of the ElliottWave-Forecast.com Team
