At Elliottwave-Forecast, we are always looking for an edge to get clues about the next market move and hence be able to better anticipate the next market move. We look at a number of instruments from around the World to get a more complete and correlated forecast as we do believe in the concept of one-market. Today, we will be taking a look at the long-term Elliott Wave Forecast for Southwest Airlines Co.
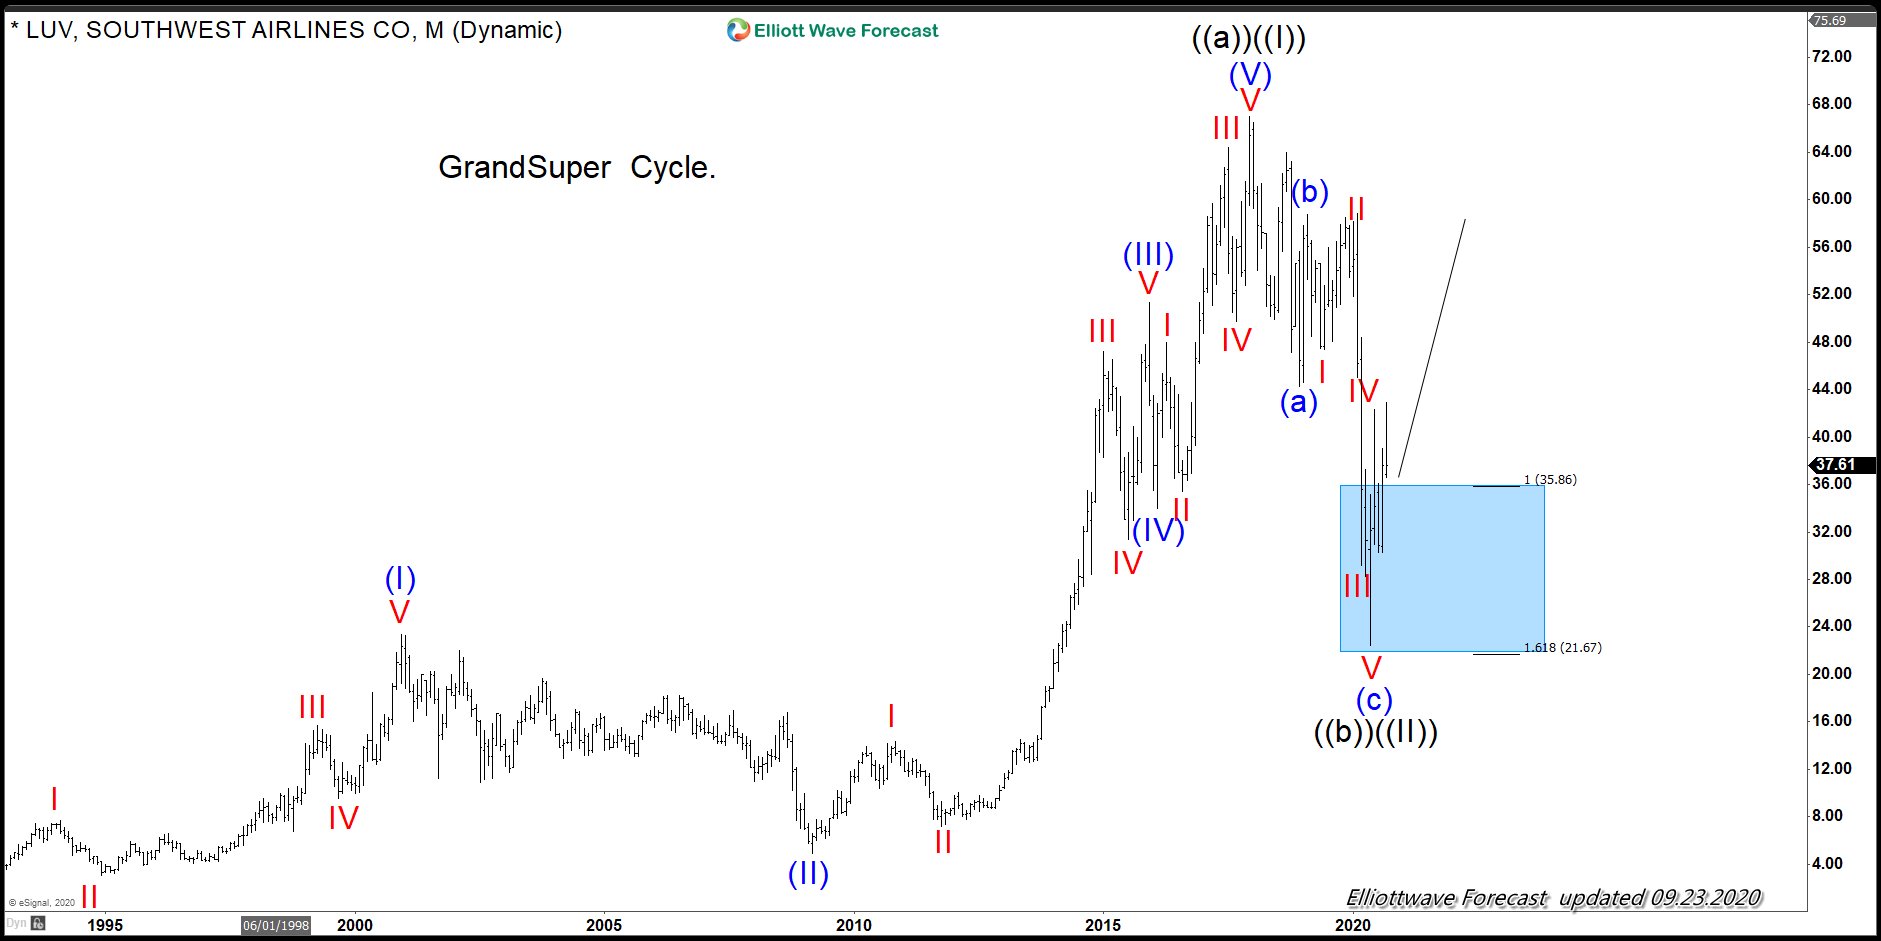
Southwest Airlines (LUV) Grand Super Cycle
Chart below shows Elliott Wave Grand Super Cycle in Southwest Airlines (LUV) within which wave (I) completed at $23.33 back in 2000. Wave (II) completed at $4.95 in 2009, this was followed by wave (III) which completed at $51.34 in 2015, wave (IV) completed at $33.96 in 2016 and wave (V) completed at $61.51 in 2017 to complete Grand Super Cycle wave ((a)). Elliott wave theory suggest after a 5 waves move up, there should be a pull back in 3 waves which is what happened. Within the pull back, wave (a) completed at$44.28, wave (b) completed at $58.77 which was followed by a sharp decline from February 2020 high to March 2020 which we expected to complete between $35.86 - $21.67. It eventually found a low at $22.47 and it turned higher again. It can still make another low in wave V of (c) but there is an incomplete sequence from the low at $22.47 low so it could continue higher. We will take a look at the sequence in the next chart.
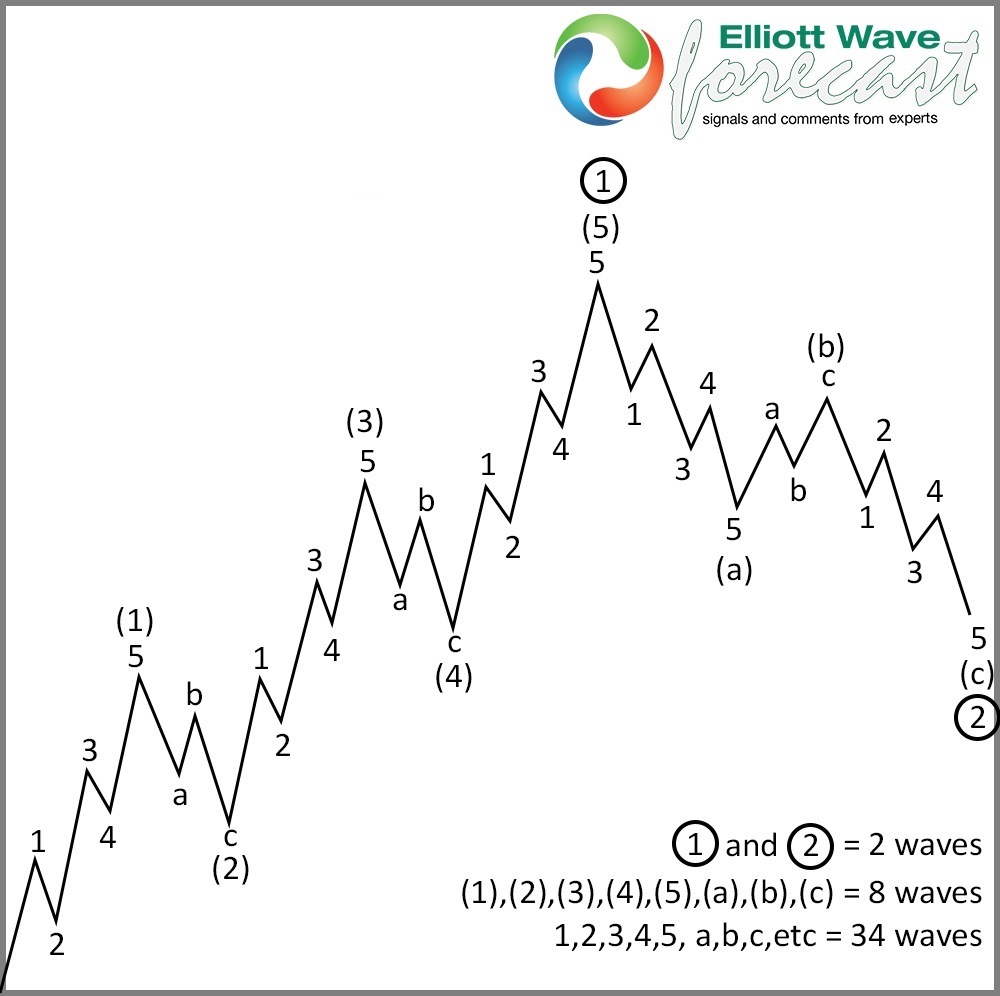
Elliott Wave Impulse
Graphic showing an impulse wave when each wave of the impulse further sub divides in 5 waves.
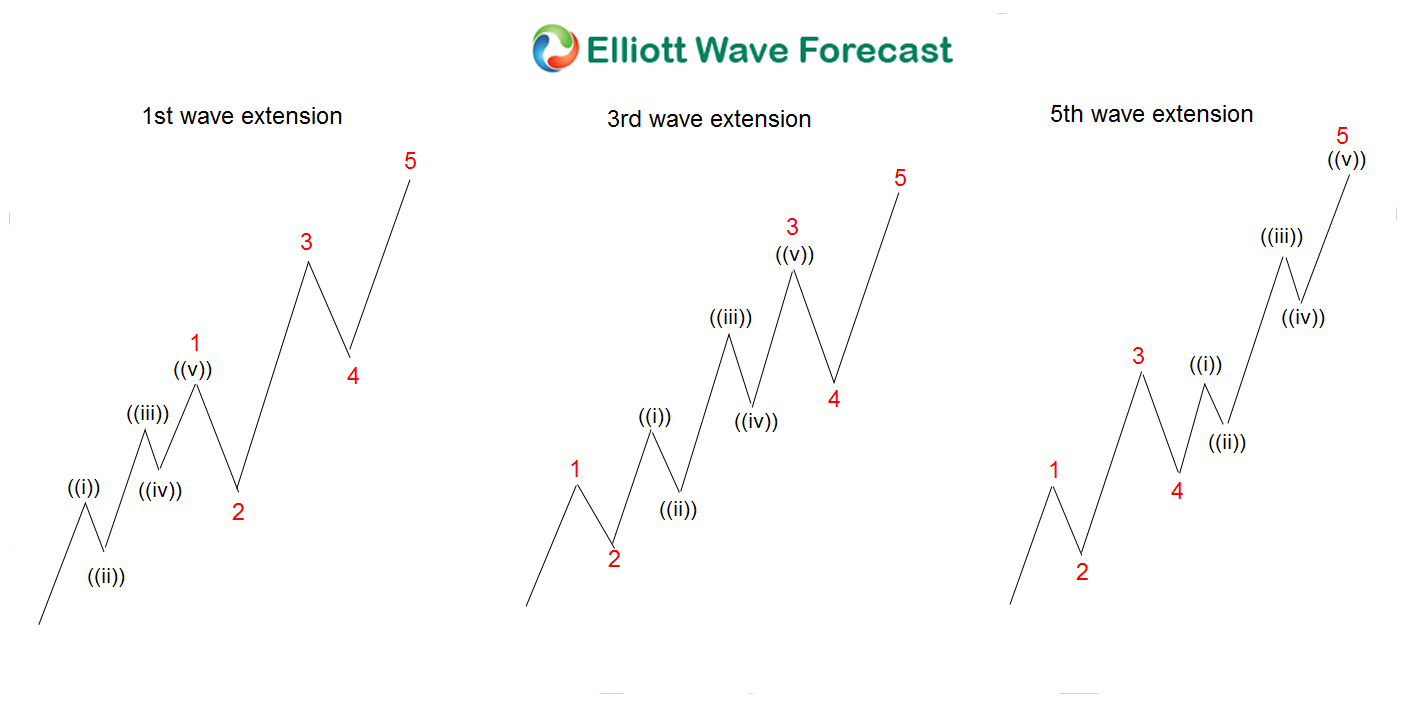
Extensions in wave 1, 3 and 5
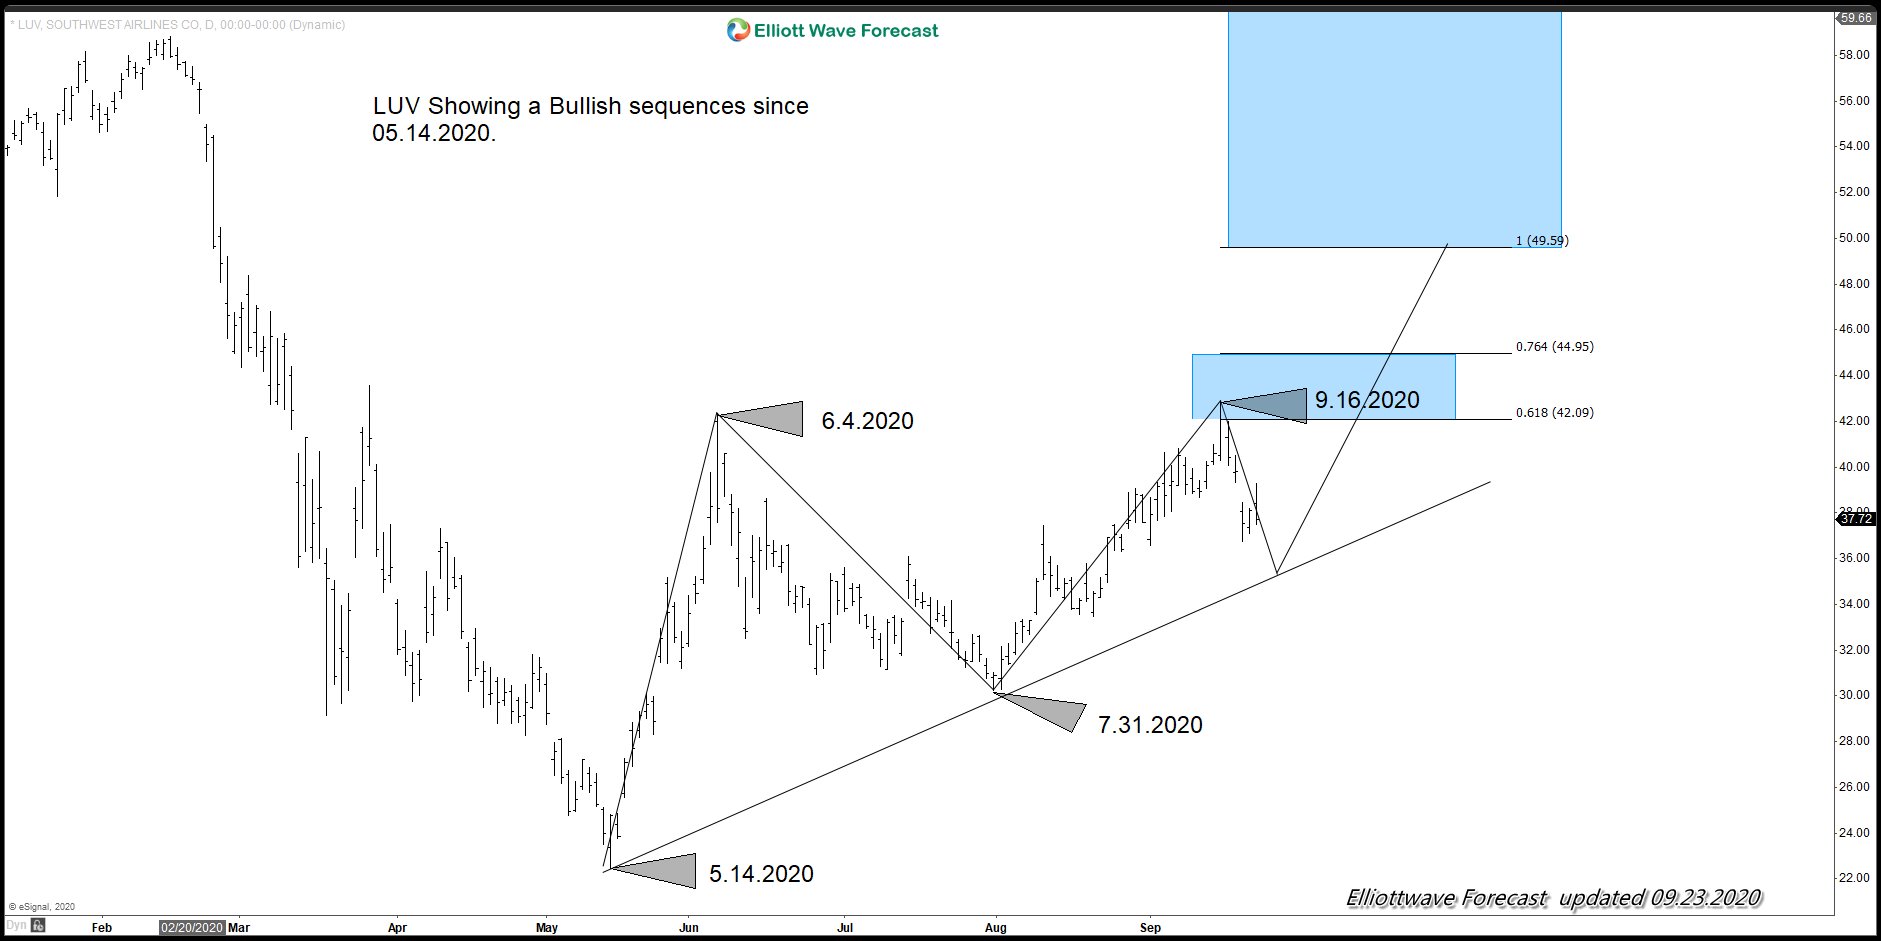
LUV Sequence from 5.14.2020 low
In the chart below, we can see a cycle from 05.14.2020 low to 06.4.2020 high followed by a pull back to 07.31.2020 low. Since then, we have seen a new high above 06.04.2020 low which creates an incomplete bullish sequence from 05.14.2020 against 07.31.2020 low and thus while above 07.31.2020 low and as the trend line holds, ideally we should see extension higher toward $49.59 - $61.72 area at least. Alternate view would be that it drops in 5 waves from 09.16.2020 peak and becomes a FLAT from 06.04.2020 peak before turning higher again. Stock seems to be close to a take off while dips hold above 07.31.2020 low. Even if a FLAT from 06.14.2020 high takes place or even if another low below 05.14.2020 low is seen, stock still remains bullish and is in a good area for investors.