


$IBM Long Term Bullish Cycle and Elliott Wave Pullback
Firstly I would like to mention Big Blue has been around for over 100 years since it was founded. I have price data that goes back to the 1960’s when the stock price was around three dollars. The point of this article is to show what Elliott Wave technical analysis suggests will happen before the stock price resumes the larger uptrend.
Secondly from the early beginnings of the company up to the March 2013 highs was simply a series of higher highs and higher lows. The weekly chart shown below is where this wave analysis begins. This decline appears to be a zig zag Elliott wave corrective structure. These structures subdivide into what wave analysts call a 5-3-5 structure. This means the first cycle ((A)) lower from the March 2013 highs to the February 2016 lows was a five wave impulse. This impulse had some overlap in between the wave (1) and wave (4). Thus it would be considered a diagonal. The bounce in the ((B)) wave connector subdivides into three corrective swings.
The analysis continues below the weekly chart.
IBM Weekly Chart
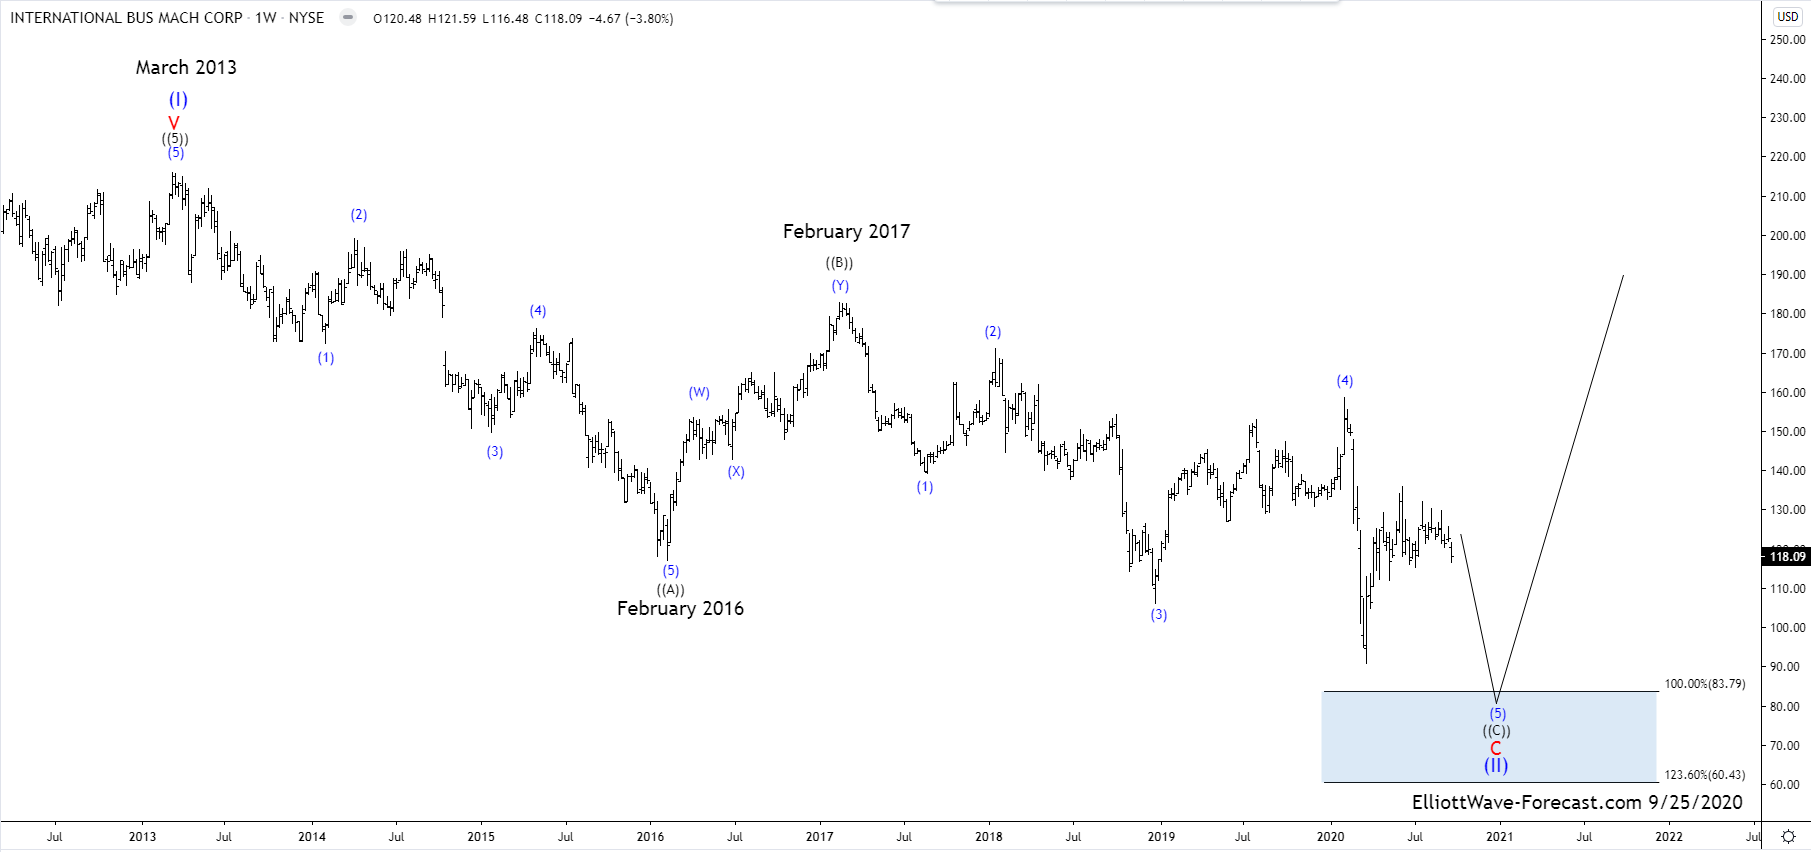
Thirdly from the February 2017 ((B)) highs price has declined in two smaller degree blue (1) & (3) impulse waves. By all means, this is an incomplete larger degree black ((C)) impulse. The wave (4) in blue correcting the cycle lower from the wave (2) highs had overlap as did the previous impulse wave ((A)) diagonal.
In conclusion as earlier mentioned the sequence lower from February 2017 appears incomplete. Although possible it will only pull back to correct the cycle from the March 2020 lows: It appears it should see another low under the March 2020 lows in the impulse ((C)) to finish the zig zag structure. Highlighted on the chart is an ideal area price can reach before resuming the larger uptrend.
