


The weekly technical structure of the Carrefour stock price is a good example of a market correction struggling with the lack of space. Hereby, we observe a situation where the price extends lower in a Elliott Wave double three pattern of multiple cycle degrees. However, the view of the bottom line forces the stock price into a truncation. If it would extend in a usual way, Carrefour stock would dive below zero which is not possible. Technically, it can become zero which would mean the end of the french supermarket chain founded 1960 in Annecy.
1999-2007: 2 swings of super cycle degree calling for one leg lower
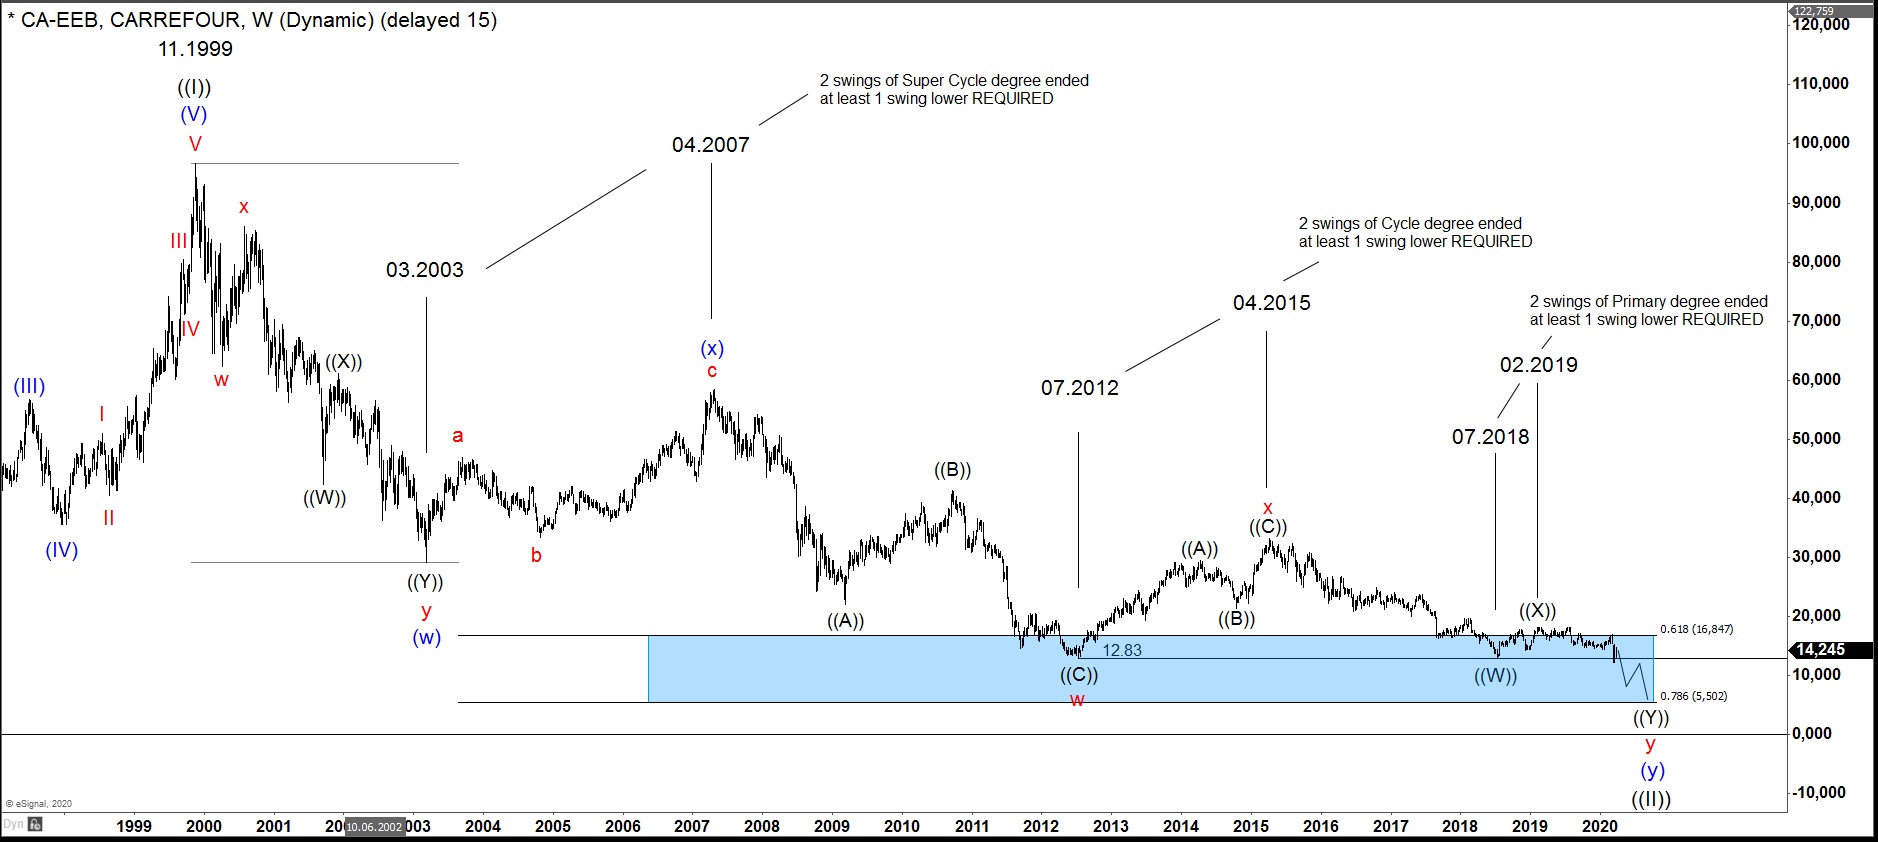
Weekly Chart of $CA below shows a cycle lower in black wave ((II)) of grand super cycle degree. It corrects the bullish cycle in black wave ((I)) which has printed the all time high on 11.1999. From there, we observe a 3 swings correction in a blue wave (w) which has bottomed on 03.2003. After a connector wave (x) towards 04.2007 highs, we see another swing lower in (y). Even though the world indices have bottommed on 2009 to resume the rally, $CA price has not reached the extension area of at least 0.618. The blue box shown on the chart expects the price to truncate at 16.85-5.5 area. There, the buyers may enter the market to resume the rally. In fact, usual extension towards equal legs does not apply as the price would dive under zero (not shown).
2007-2015: 2 swings of cycle degree calling for one leg lower
The cycle lower from 04.2007 highs in blue wave (y) could have finished in 3 swings on 07.2012 at 12.83. Technical indicator RSI has confirmed that the bigger corection from 1999 highs could be over. So technically, from 07.2012 lows, the rally may resume. Indeed, the bounce in price has occured. Unfortunately, it has failed in 3 swings on 04.2015. The first two swings are, therefore, counted as red waves w and x. From 04.2015 highs, another leg lower in red wave y can be witnessed. Similar to previous, one should expect the extension area of 0.618 in order for price to stay above the zero line.
Carrefour extends lower in a truncated form
2015-in progress : 2 swings of primary degree calling for one leg lower
The cycle lower from 04.2015 highs in red wave y has finished the first wave ((W)) of primary degree on 07.2018. Thereafter, the bounce higher occured in black wave ((X)) which has printed a top on 02.2019. Finally, one leg lower in black wave ((Y)) can be expexted. And again, it should truncate at 0.618 extension in order for price to stay positive. Clearly, $CA is struggling with the lack of space to the downside.
Outlook : Carrefour to bounce soon
Now, by breaking the 07.2018 lows at around 12.80, $CA has opened a bearish sequence against 02.2019 highs related to 04.2015 highs. While below 2019 highs, expect the price to extend down to the inflection area of multiple degrees towards 5.50. If the price will achieve that level without RSI divergence, the grand super cycle wave ((II)) may finish and Carrefour can resume the rally to the new highs towards 100 and even higher.
