


GLD Longer Term Cycles and Elliott Wave Analysis
Firstly the GLD ETF fund is one of the largest as well as one of the oldest Gold tracking funds out there since it's inception date of November 18, 2004. From there on up into the September 2011 highs it ended a larger bullish cycle as did the Gold commodity in terms of US dollars. From the September 2011 highs the price decline was pretty steep however does appear corrective as a double three (a)-(b)-(c) (in blue color) into the December 2015 lows.
The analysis continues below the monthly chart.
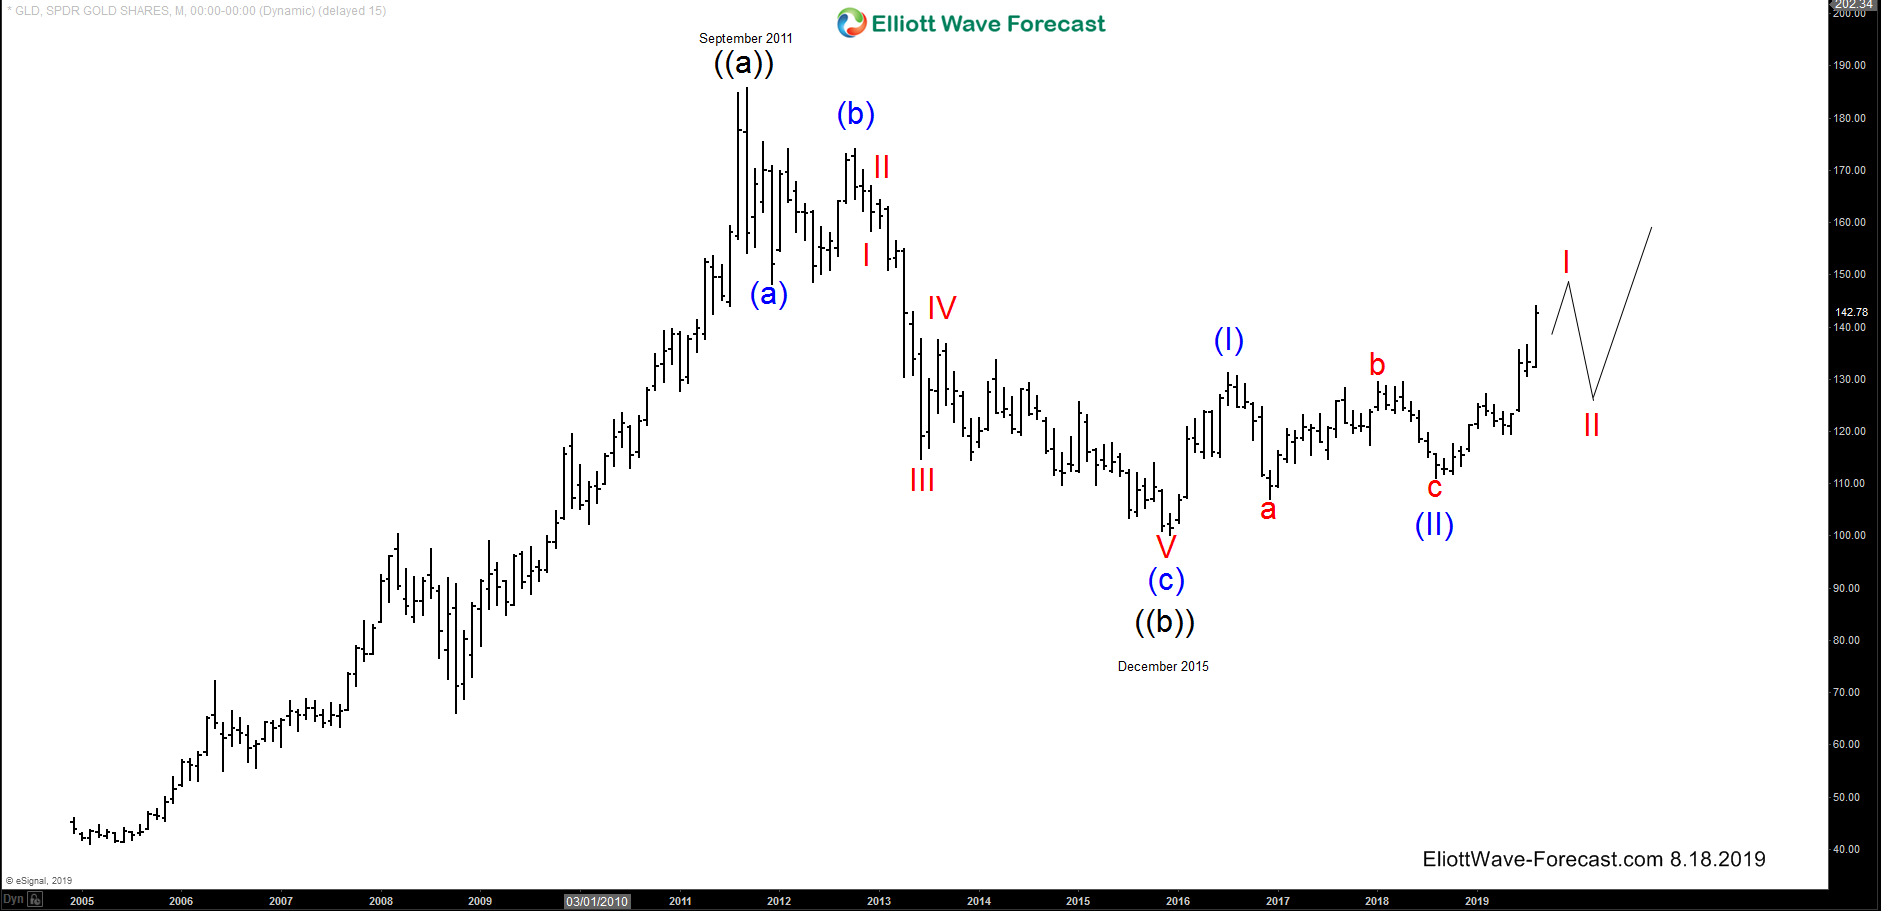
Secondly I would like to mention that the bounce from the December 2015 lows at 100.23 into the July 2016 wave (I) highs (in blue) is clearly an Elliott Wave impulse. The bounce was strong enough to suggest it ended the cycle lower from the September 2011 highs as well thus at this point it is very much suspected to be resuming a long term bullish trend from the December 2015 lows. As shown above from there the metal made a wave (I) high in July 2016. From there it appears to have made an a-b-c (in red) running flat structure to end the wave (II) (in blue) at the August 2018 lows of 111.06.
The analysis continues below the weekly chart.
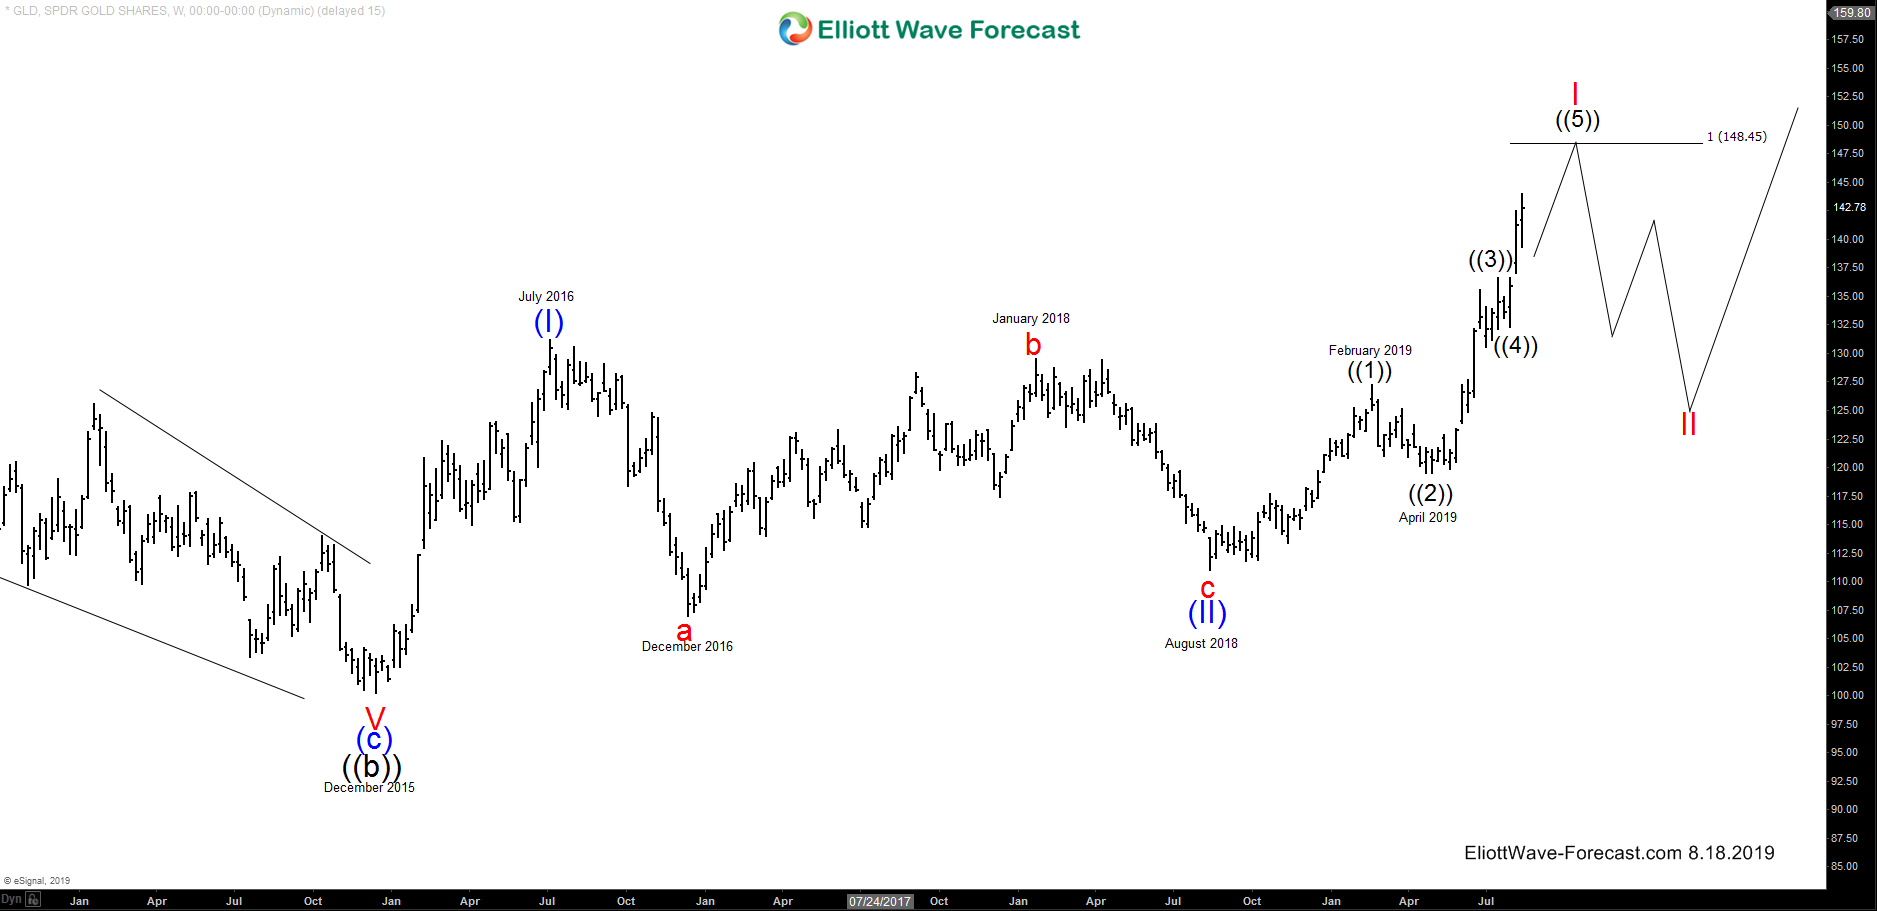
Thirdly in conclusion: From the wave (II) (in blue) lows of August 2018 lows at 111.06 the bounce higher in wave ((1)). It was strong enough to suggest it was finished with the wave (II) running flat structure.
In summary the cycle higher from the August 2018 lows appears to have an incomplete bullish sequence of five waves up in an Elliott Wave impulse. There is not a lot of time separation in the wave ((4)) (in black) related to the wave ((2)) (in black). However the technical indicators we use here suggests the pullback into the wave ((4)) lows (in black) from 8/1/2019 corrected the cycle up from the April 2019 wave ((2)) lows. The minimum target area for wave ((5)) of I has been reached. However while it remains above the 8/1/19 lows it may see the wave ((5)) equals wave ((1)) area at 148.45. Afterward it can see a pullback in the wave II (in red) correct the cycle up from the August 2018 lows before resuming higher again.
