


The USDX has been trending higher since the lows in 2008. However, in trading, nothing lasts forever. New traders generally do not last very long in this field, thus most traders only know a strong $USDX due to recency bias. However, in reality, nothing lasts forever, so we at EWF track many different instrument to be able to read the market the right way. We look at various asset categories to gather information which otherwise can't be gathered by just looking at a few instrument.
This article will explain how the $USDINR is telling us about the stage of the $USDX cycle and why we need to be careful soon about chasing the Dollar higher. The Rupee is one of the pairs the US Dollar has been trending with a very well defined channel since the all-time lows. The following chart is a representation of the Grand Super Cycle in the pair.
$USDINR Quarterly Elliott Wave Chart
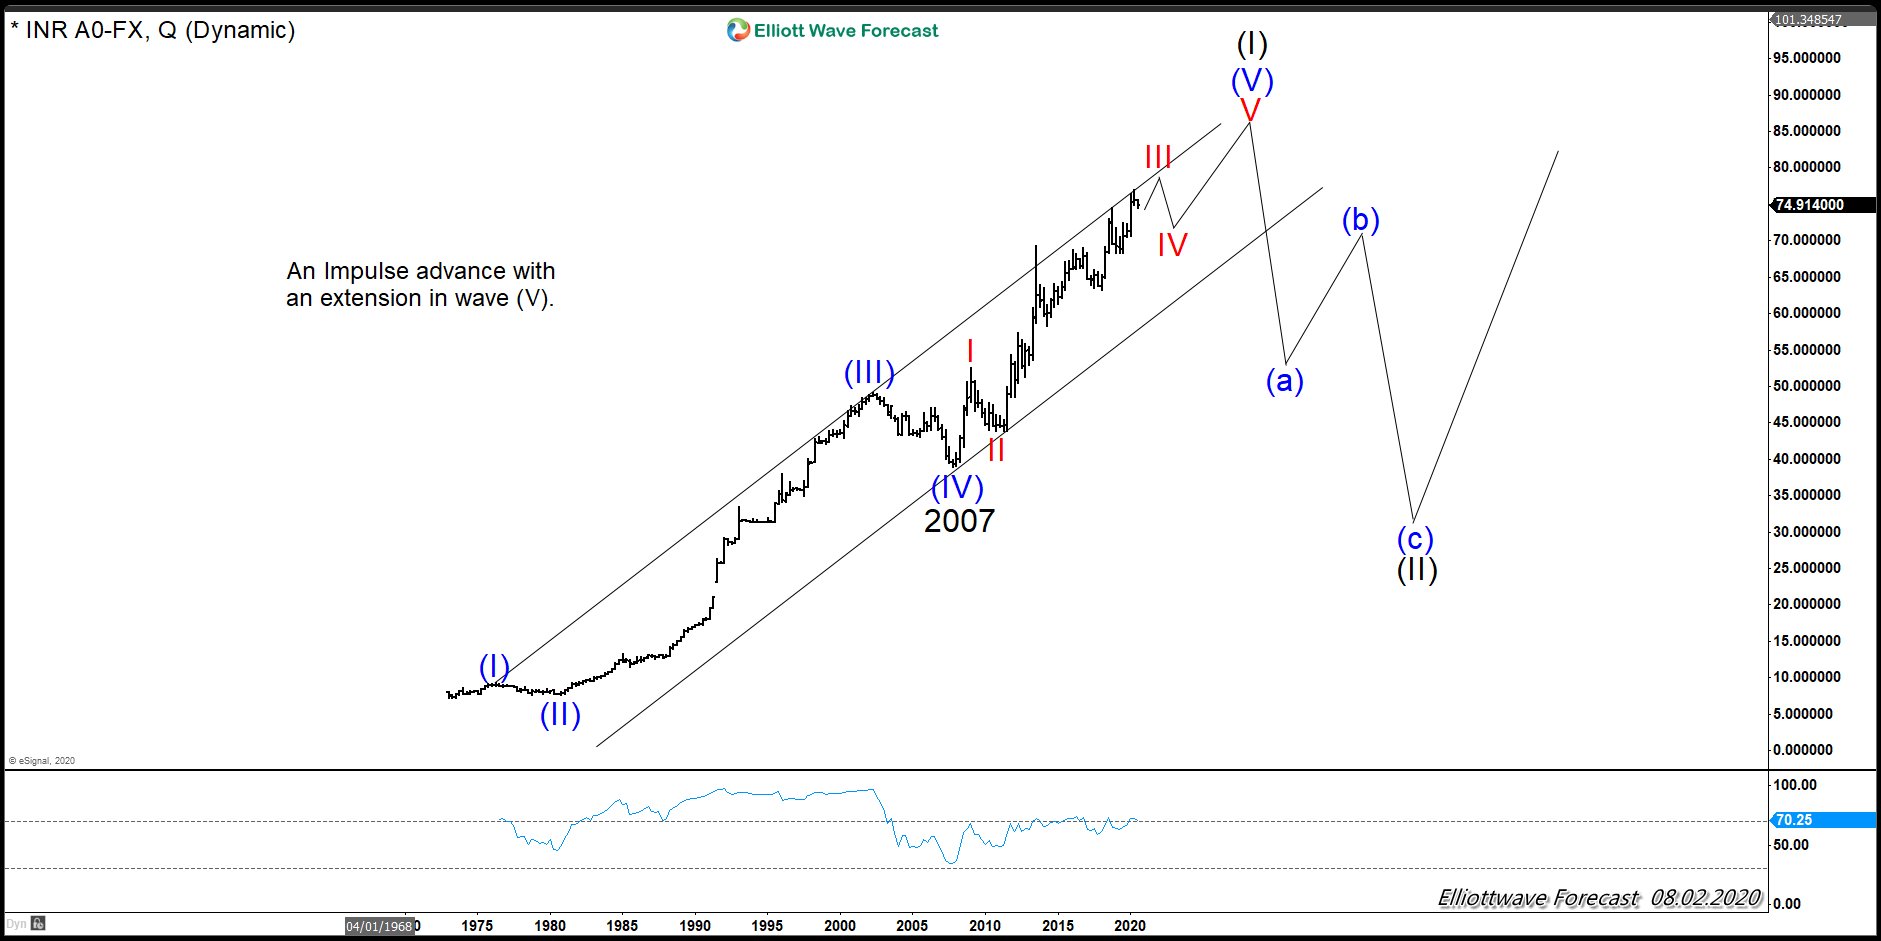
As we can see in the above chart, the advance has a very well defined channel. Channels are one of the best tools in the Elliott Wave Theory. We can use channel to define an impulse as well as the subdivision of an impulse within the main cycle. Since the all-time lows, we can define a clear (I)-(II)-(III)-(IV)-(V) in blue. The pair is currently trading within an extended wave (V). The charts below show several different variations of an extension in an impulse:
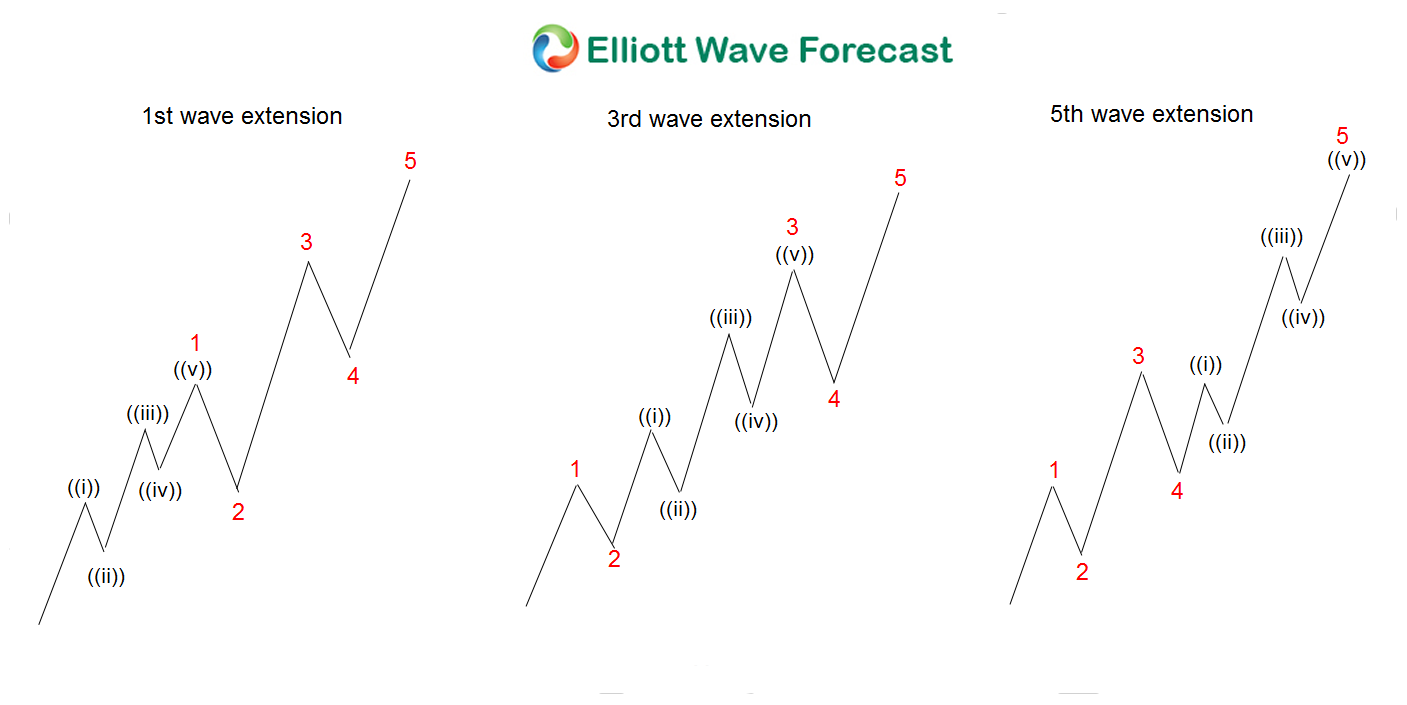
Extension always happens in one of the three impulses advance within a five waves advance. The $USDINR is extending within wave (V) due to the lack of momentum since the lows in 2007. We can see how the RSI shows a momentum divergence which is an indication why the cycle is ending soon.
Looking at the Weekly Time Frame below, we can see the advance since the lows in 2007 as an impulse. The rally is part of the Grand Super Cycle.
$USDINR Weekly Elliott Wave Chart
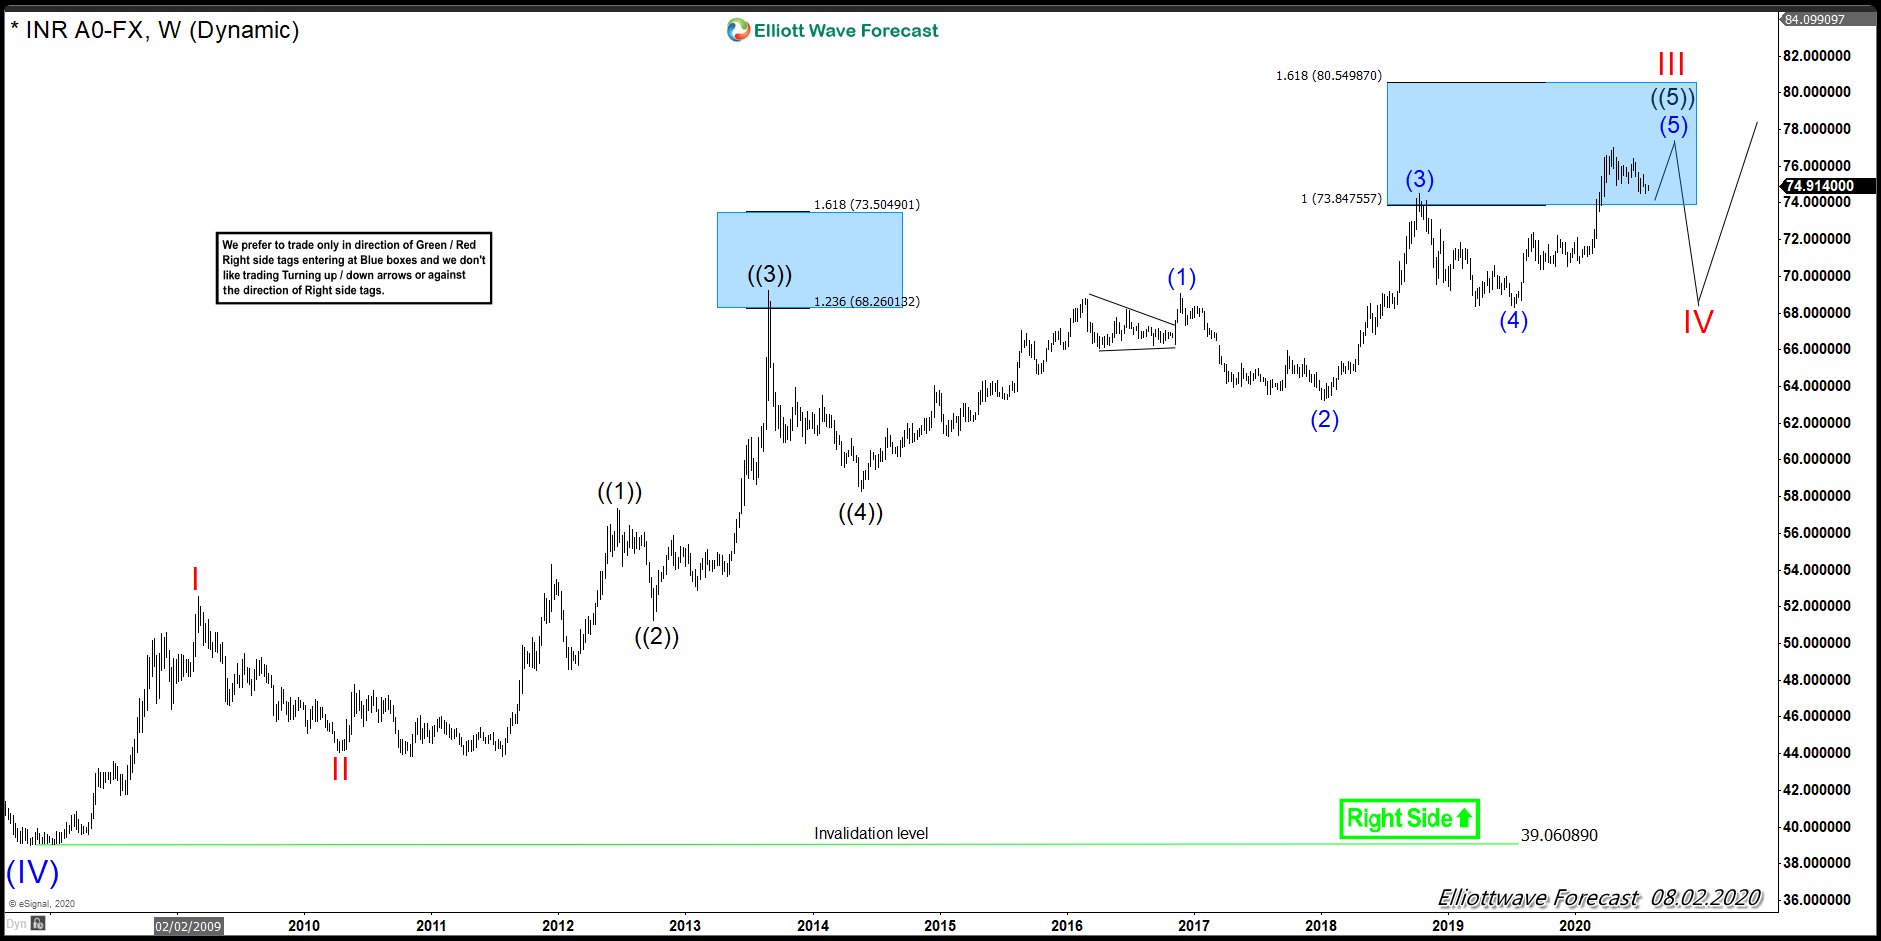
We should be ending wave III soon but should see still more upside within this cycle. The weekly advance is in seven swings since the lows at wave (IV). Counting it from the lows at red II, then the advance is in seventeen swings. Both are an indication that more upside should happen overall. As we have mentioned before, the $USDX cycle is mature across the market.
As far as the $USDINR stays above the Elliott Wave Channel, extension higher should happen. Consequently, the $USDX should also be supported. But as pair is ending wave III within the 2007, this represents choppiness across the $USDX pairs in the months to come. It will provide soon a very nice entry into the finals stages of the $USDX cycle since 2008. As always, forecasting the market is not an easy task. However, using the Elliott Wave Theory the right way and correlating various instrument using channels, sequences, and swings counts can provide us with an edge in trading. It also allows us to trade with higher convictions and spots any warning the market is sending us. For now, let's enjoy the $USDINR ride, but let's keep an eye at the channel since the all-time lows to gather whether or not to chase the $USDX higher.
