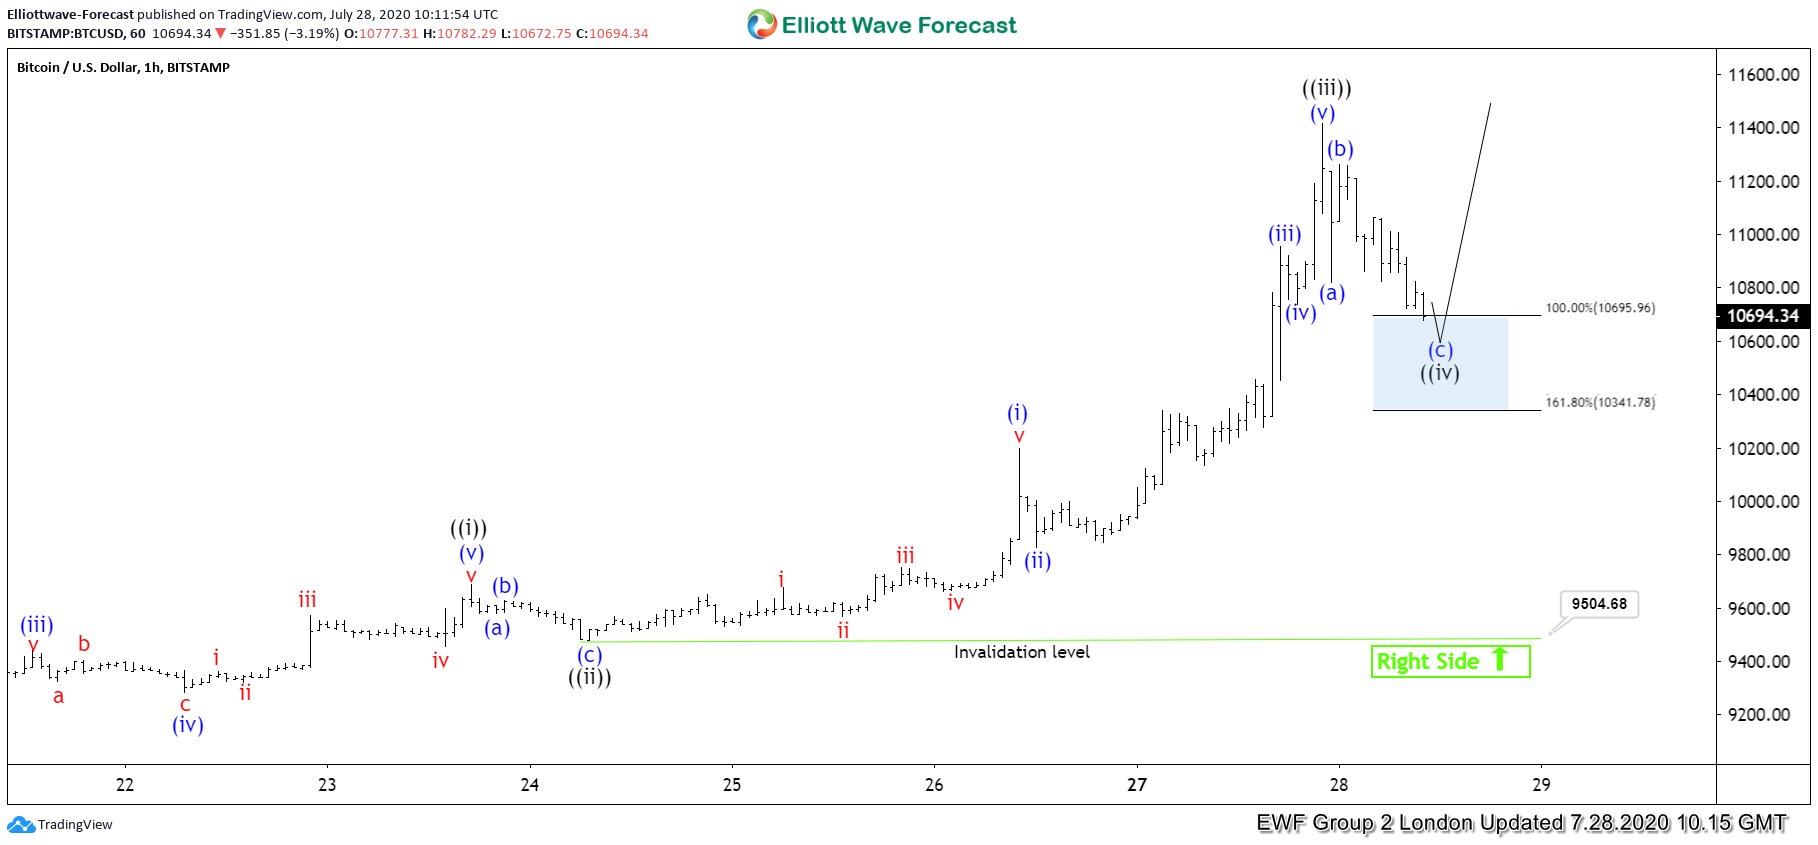
In this blog, we are going to take a look at the Elliott Wave chart of Bitcoin (BTC/USD). The 1 hour London chart update from July 28 shows that the cryptocurrency ended wave ((iii)) at 11417.11 high. The pair then did a pullback in wave ((iv)). The pullback reached the 100 - 161.8% extension of wave (a)-(b). That area was highlighted with a blue box. A blue box is an area where we expect buyers to appear for 3 waves bounce at least. The cryptocurrency can still make another low within the blue box. However, as long as the 161.8% extension stays intact, Bitcoin is expected to bounce soon from the blue box.
Bitcoin (BTC/USD) 7.28.2020 1 Hour London Elliott Wave Chart
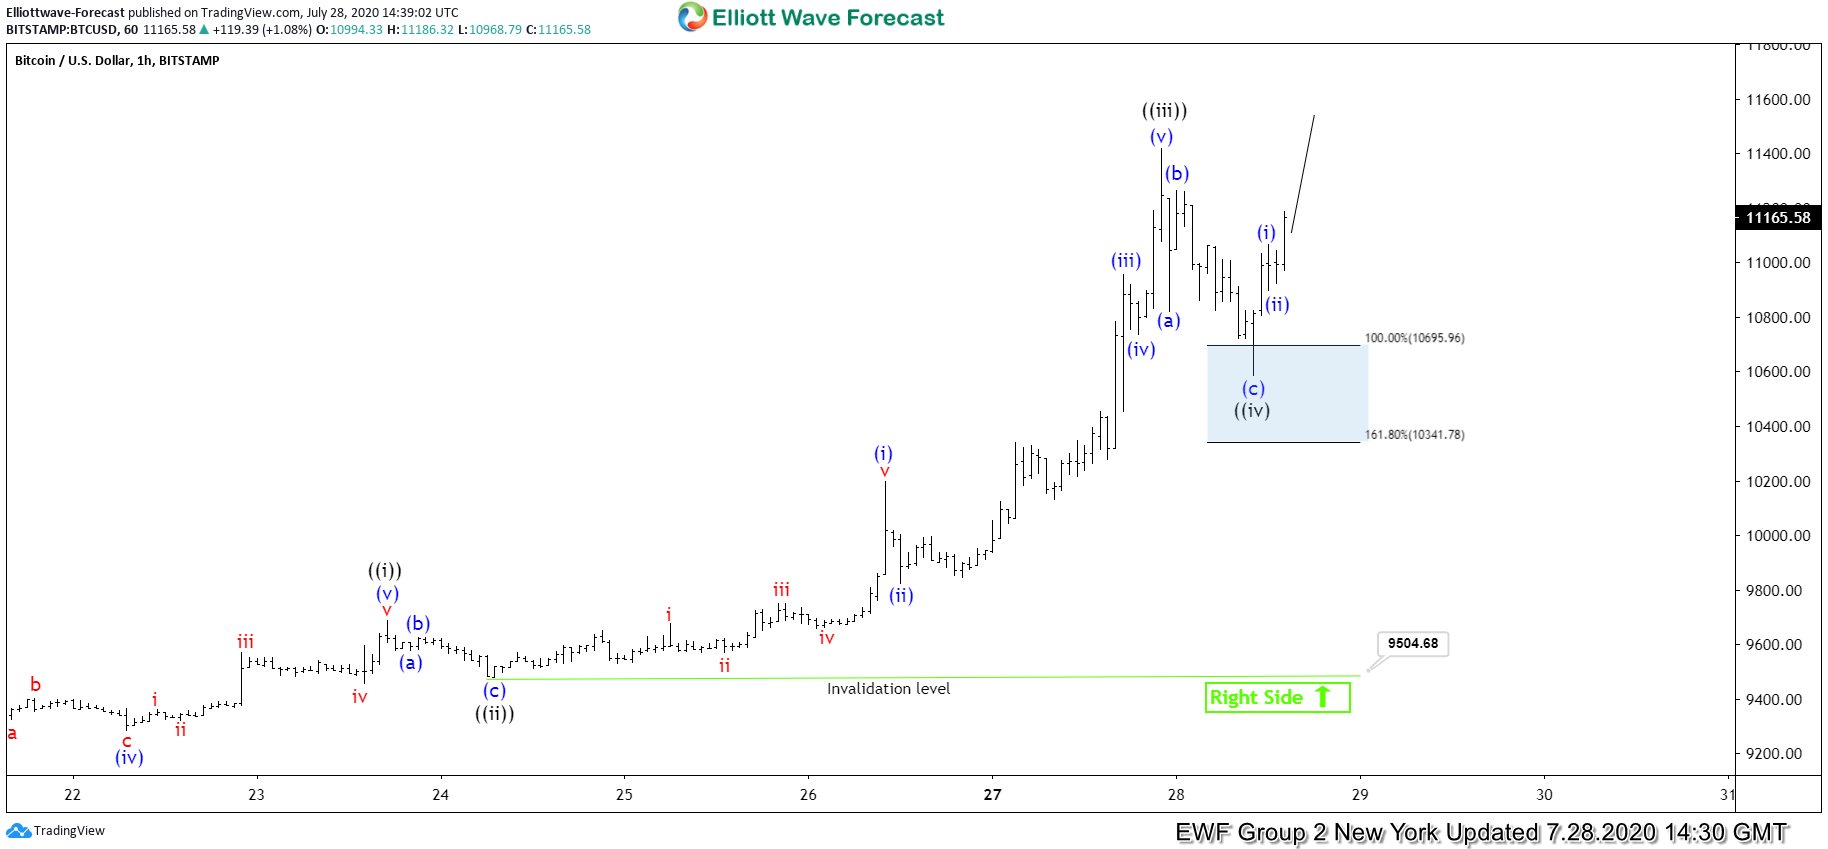
July 28 1 hour New York chart shows that the cryptocurrency ended wave ((iv)) pullback at 10583.48 low. From there, it has turned higher, allowing any buyers at the blue box a risk free position. However, the cryptocurrency still needs to break above wave ((iii)) high to confirm that wave ((iv)) is already in place and the next leg higher has already started.
Bitcoin (BTC/USD) 7.28.2020 1 Hour New York Elliott Wave Chart
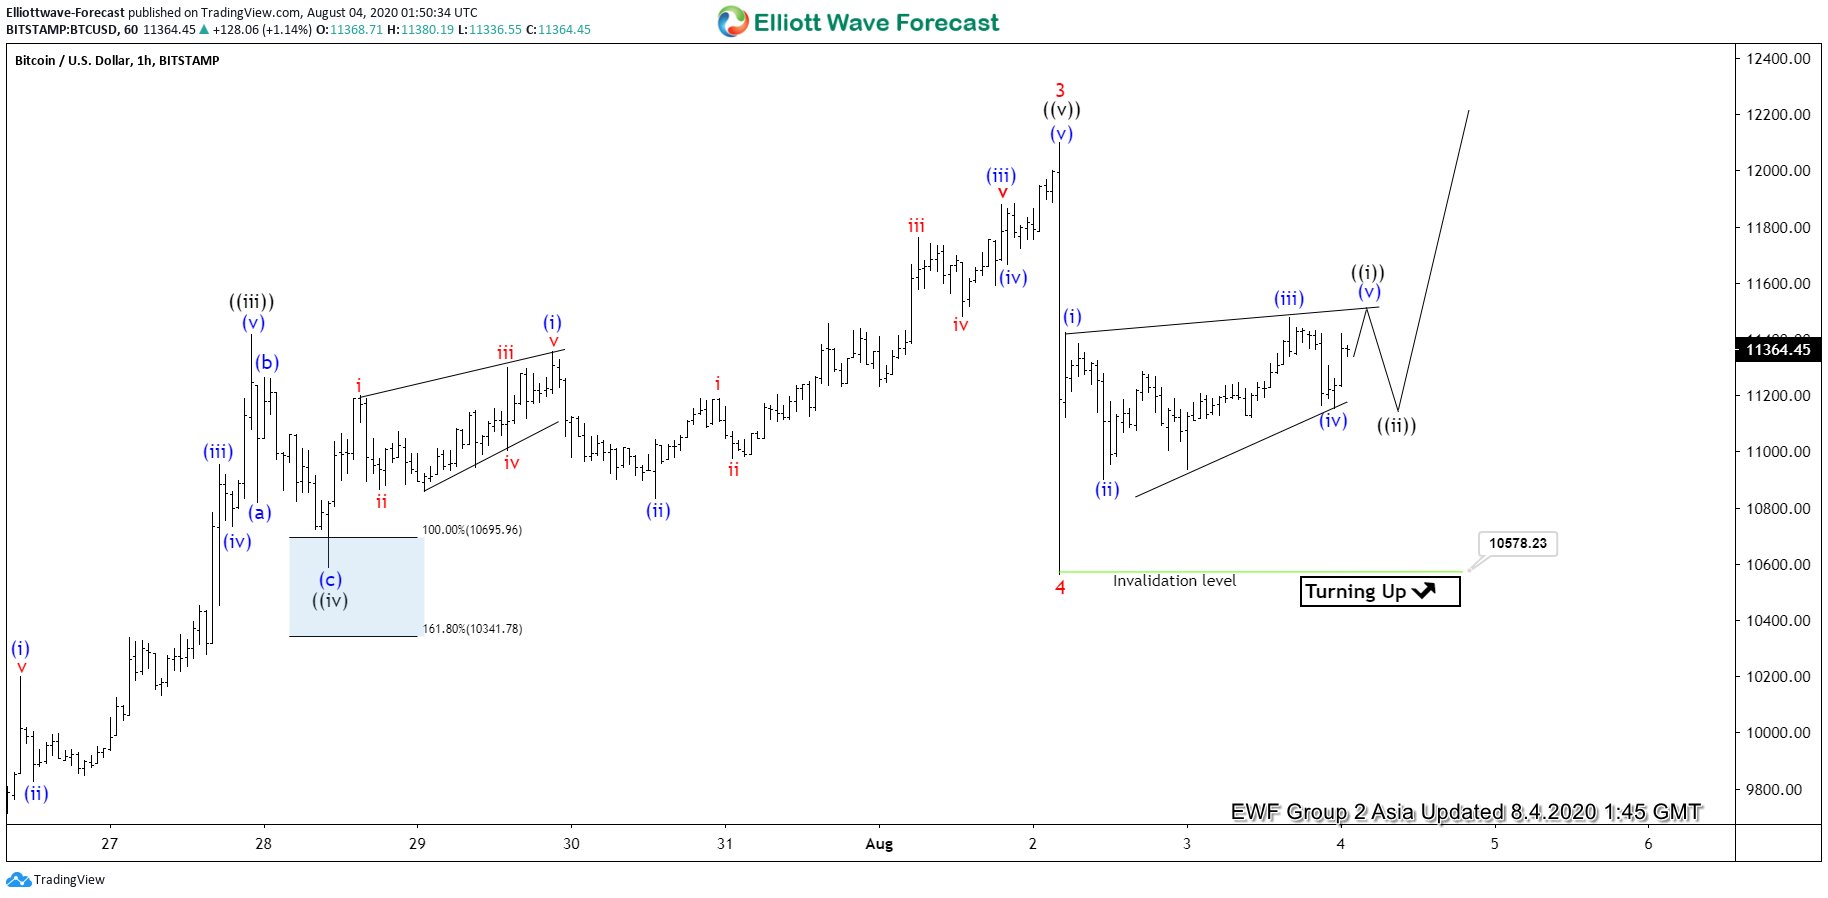
The latest 1 hour Asia chart from August 4 shows that Bitcoin broke above wave ((iii)) high. It then extended higher and ended wave ((v)) at 12100 high. This also ended wave 3 in the larger degree. The cryptocurrency then did a correction in wave 4, which ended at 10578.23 low. While above that low, the dips in 3,7 or 11 swings are expected to find support for more upside. However, it needs to break above wave 3 high to confirm the next leg higher is in progress. If the low at 10578.23 breaks, then Bitcoin could be doing a double correction in wave 4. Nonetheless, if the cryptocurrency does a 7 swing correction, the equal leg should still see buyers appear for 3 waves bounce later.
Bitcoin (BTC/USD) 8.4.2020 1 Hour Asia Elliott Wave Chart