


In this technical blog, we are going to take a look at the past performance of AUDJPY 1-Hour Elliott wave Charts that we presented to our members. In which, the cycle from 4/29/2019 peak (78.93) took place as impulse Elliott wave structure with right side tags pointing lower calling for more downside. Therefore, our members knew that selling the bounces into the direction of the right side tag remained the preferred path. We will explain the Elliott wave structure & selling opportunity our members took below:
AUDJPY 1 Hour Elliott Wave Chart Showing Selling Opportunity
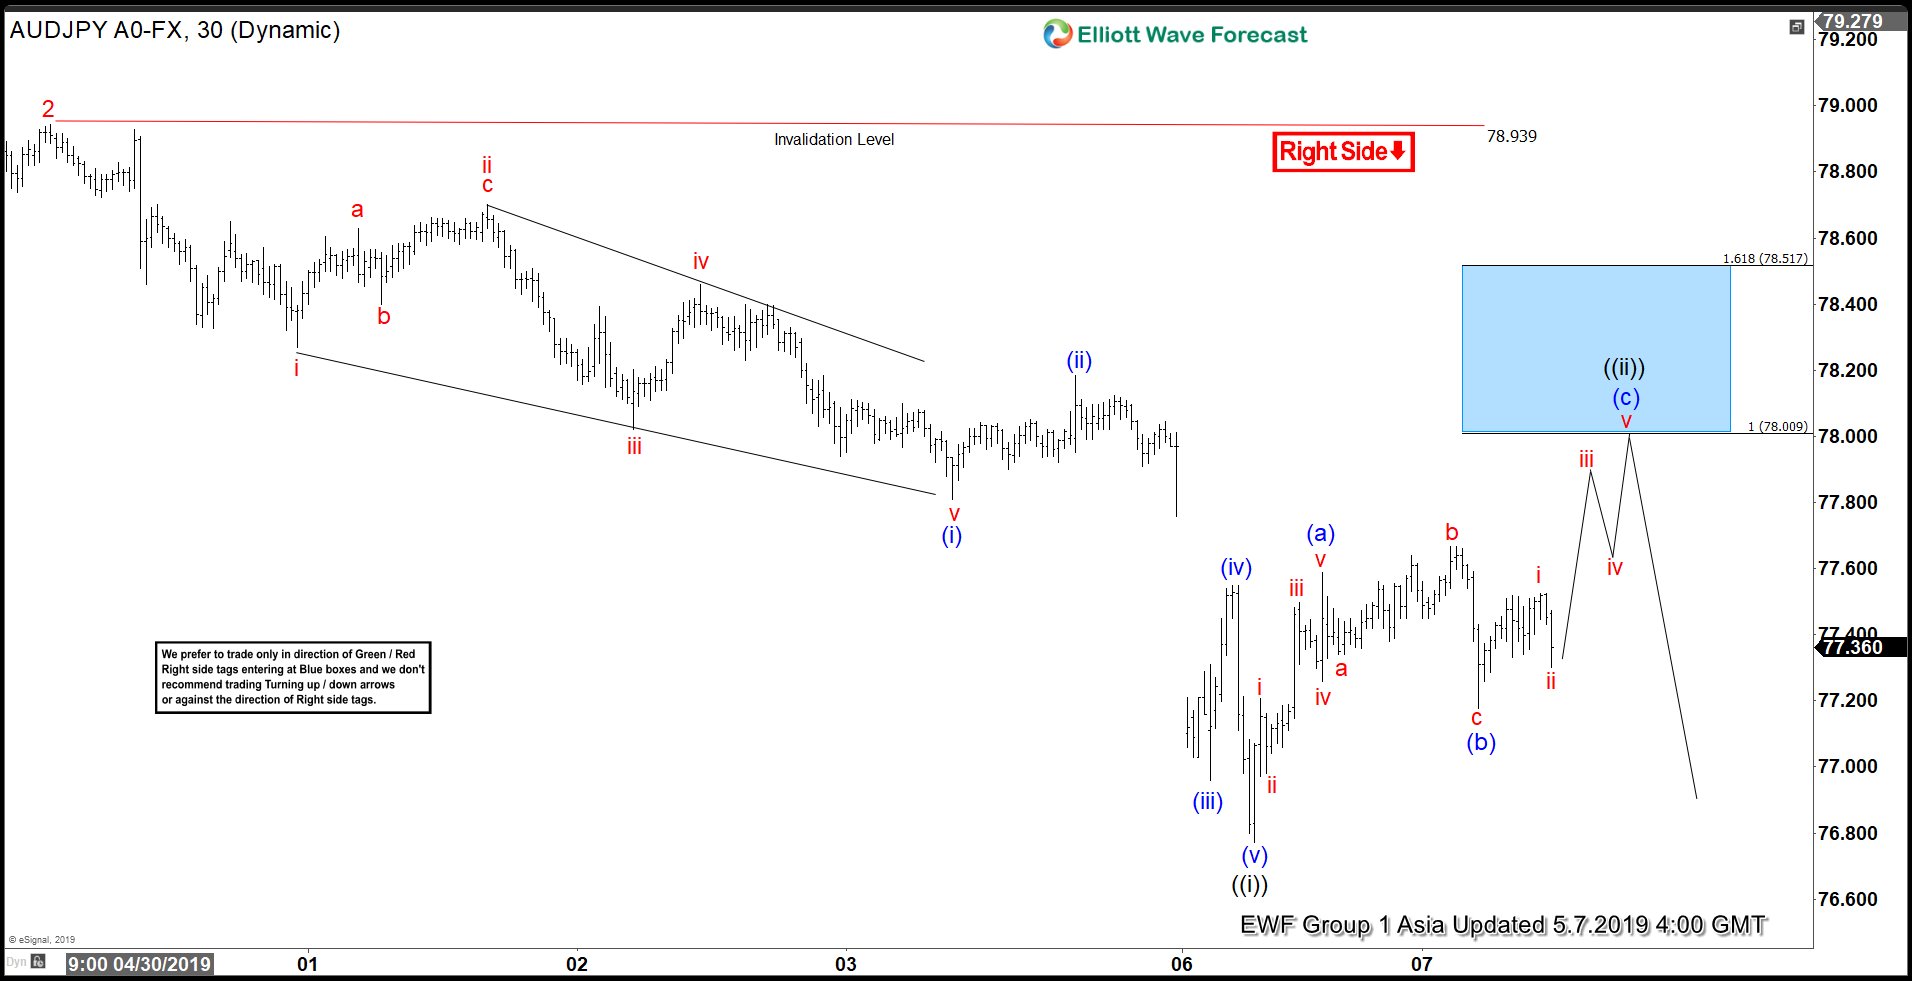
From 4/29/2019 peak (78.93) the internal structure unfolded as impulse where Minutte wave (i) ended at 77.81 low. Minutte wave (ii) ended at 78.18 high, Minutte wave (iii) ended at 77.19 low and Minutte wave (iv) ended at 77.55 high. Down from there, Minutte wave (v) ended at 76.77 low which also completed Minute wave ((i)). Up from there, the pair corrected higher the cycle from 4/29/2019 peak in Minute wave ((ii)).
The internal of that bounce unfolded as Elliott wave Zigzag structure where Minutte wave (a) ended at 77.58 high. Minutte wave (b) ended at 77.18 low and Minutte wave (c) was expected to reach 78-78.51 100%-161.8% Fibonacci extension blue box inflection area. From where sellers were expected to appear in the pair looking for more downside into the direction of right side tag lower. Or for 3 wave reaction lower at least allowing members to go risk-free in the trade.
AUDJPY 1 Hour Elliott Wave Chart Found Sellers & Turned Lower As Expected
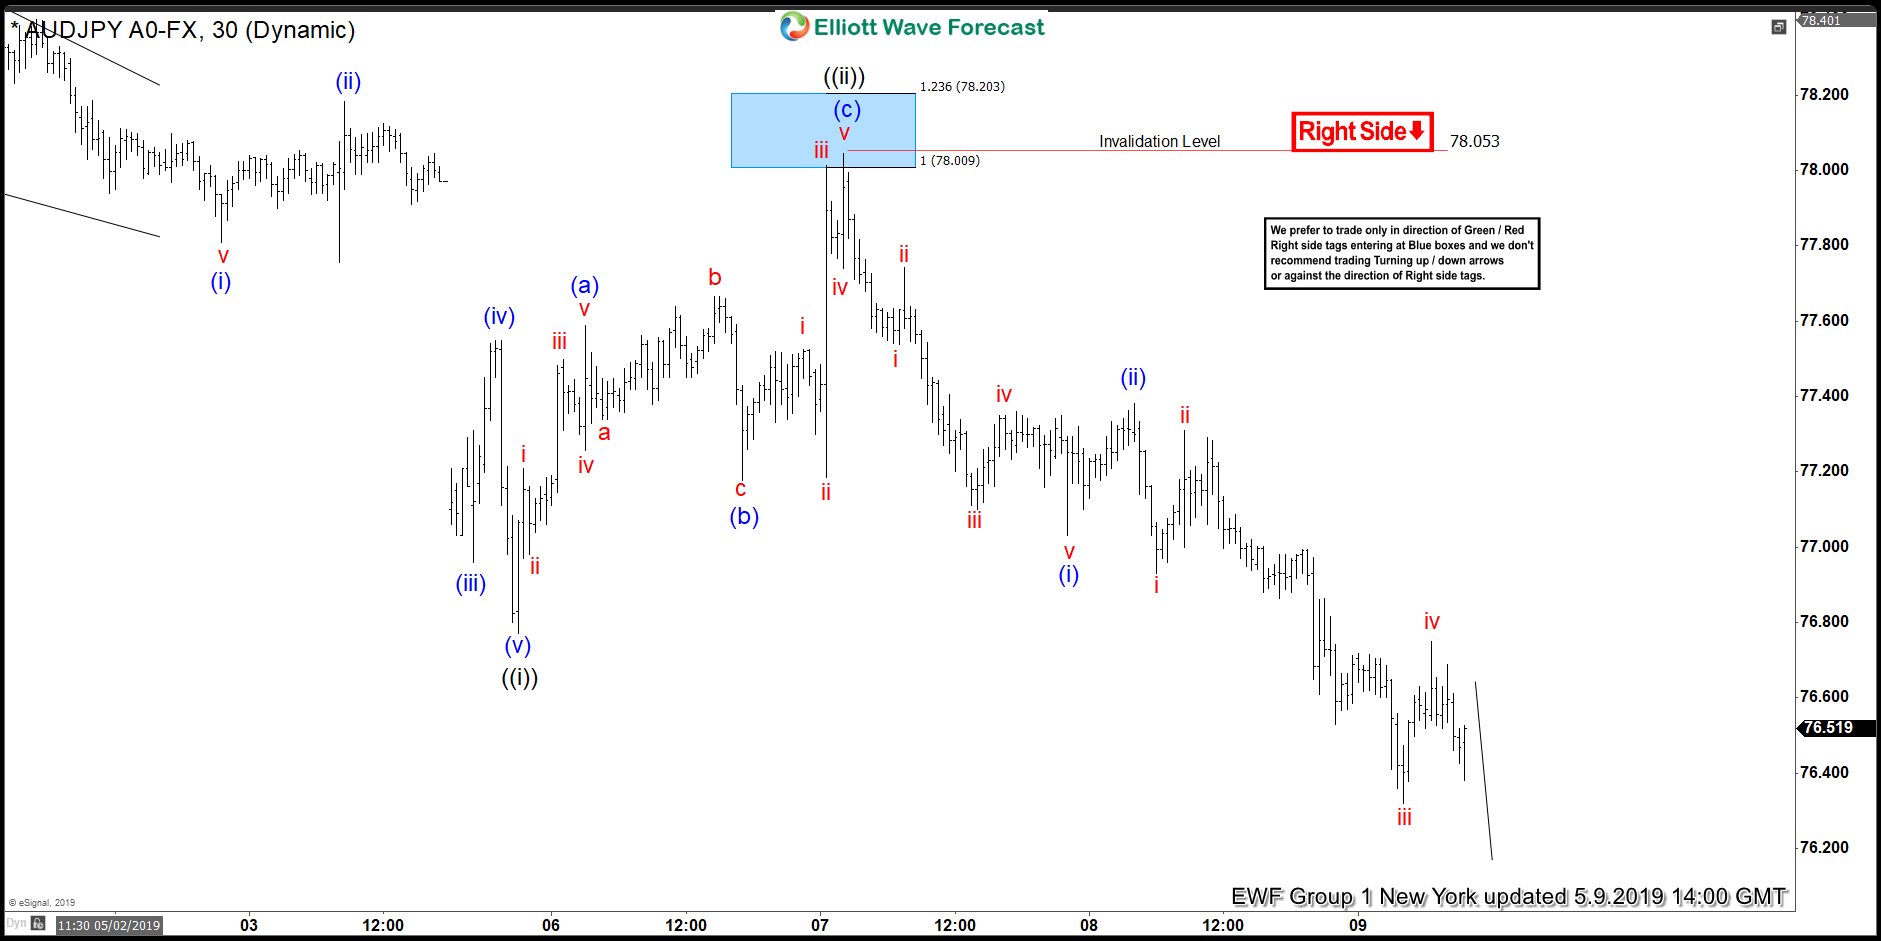
AUDJPY found sellers at 78-78.51 100%-161.8% Fibonacci extension blue box inflection area as highlighted above by ending Minute wave ((ii)) bounce at 78.05 high. And made the reaction lower as expected to allow members to create a risk-free position.
Keep in mind that the market is dynamic and the view could change in the meantime. Success in trading requires proper risk and money management as well as an understanding of Elliott Wave theory, cycle analysis, and correlation. We have developed a very good trading strategy that defines the entry. Stop loss and take profit levels with high accuracy and allows you to take a risk-free position, shortly after taking it by protecting your wallet.
