
| Instrument | IBM |
| Time Frame | DAILY |
| Fundamentals | Price: $134.26 |
| Dividend Yield: 4.8% | |
| Current Dividend Annualized: $6.48 | |
| Normalized Diluted Earnings Per Share (TTM): $8.32 | |
| Earnings Report: 10/17/19 | |
| Next Earnings Report: 1/22/20 | |
| Recommendation | Large Diversified Dividend Portfolios / Should Be Considered |
| Looking For Exposure to Technology Sector / Should Be Considered | |
| Deep Value Investors / Should Be Considered | |
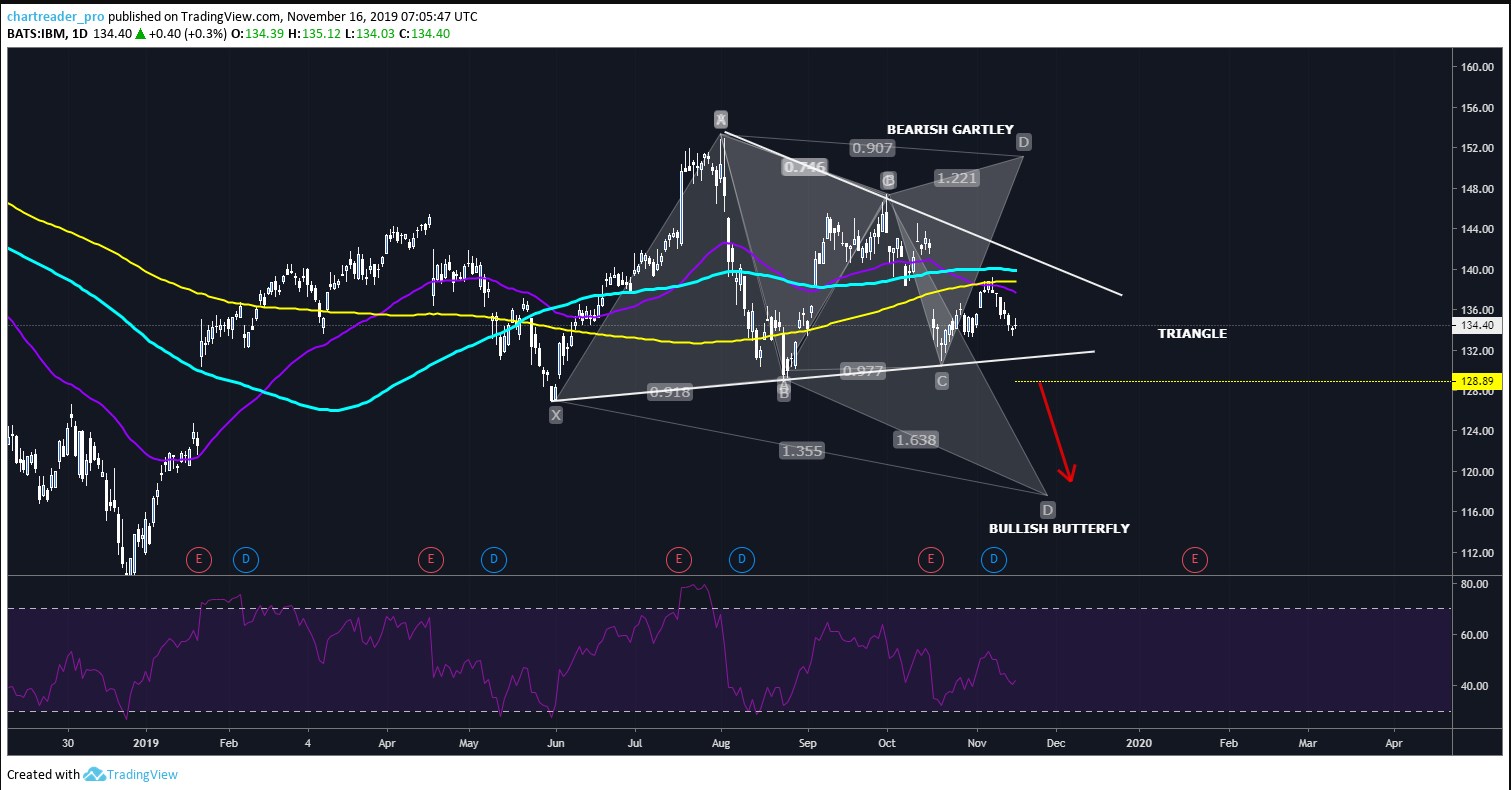
| Technicals | Stock is pricing below EMA50 SMA100 SMA200 Daily |
| Trading in a triangle | |
| Potential Bearish Breakout of the triangle 131.000 | |
| Main Trend | Neutral |
| The direction in The Chart | Down |
| Pattern/ Signal | Triangle Breakout |
| Trade Signal | Sell |
| Accuracy | 64% |
| Estimated Completion Time | 4-9 D1 Chart |
| Entry 1 | 131.000 |
| Entry 2 | |
| Invalidation Level ( Stop Loss) | 134.500 |
| Target 1 | 128.120 |
| Target 2 | 125.00 |
| Target 3 | 121.880 |
| Target 4 | 118.100 |
|
|
Bullish Butterfly Pattern would be completed at 117.500. |