
YTD Job Cuts Highest Since 2009
The May monthly construction spending report was very bad as it was down 0.8% monthly and 2.3% yearly. The weakness is in residential construction, specifically, in single-family residential construction. Residential construction spending fell 11.2% yearly. Single-family spending fell 7.6% and multi-family spending was up 9.3%. Single-family housing has become unaffordable which is why multi-family housing is being built at a higher growth rate.
Big Decline In Residential Construction
As you can see from the charts below, spending on multi-family housing is significantly below that of single-family housing, so it can’t push overall growth to the positive side.
(Click on image to enlarge)
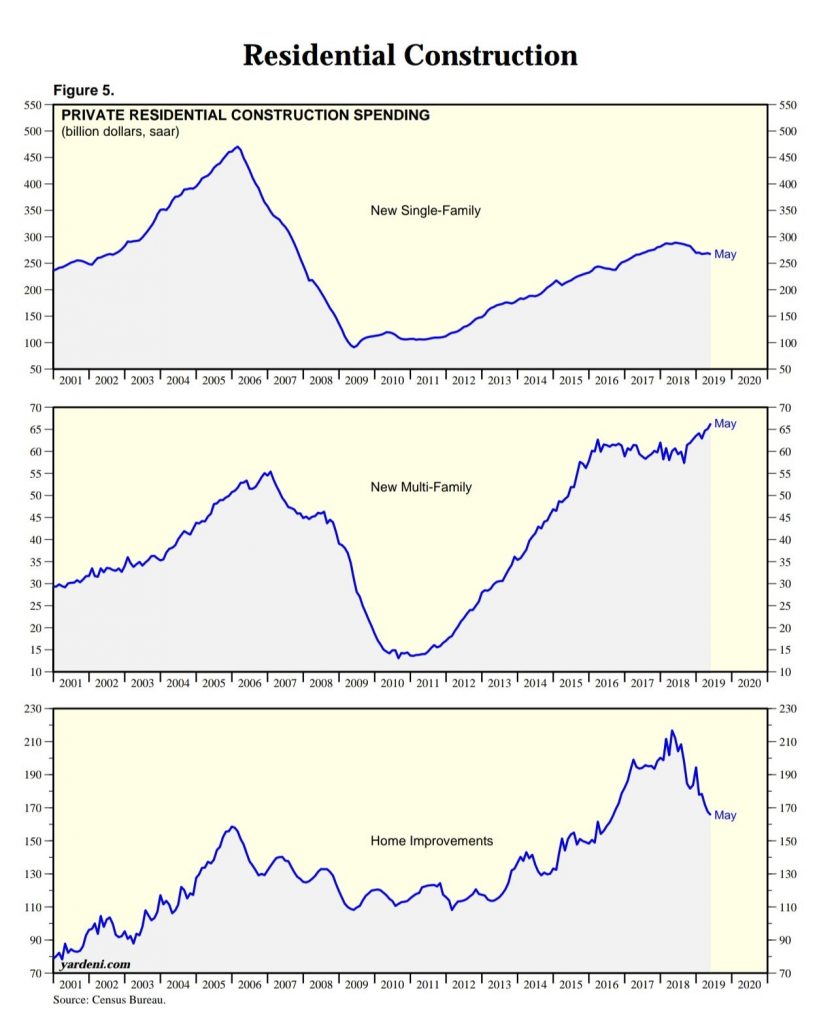
On a related note, Oregon recently passed a law that effectively bans single-family zoning laws, allowing more affordable multi-family housing to be built. The weakest part of this construction report was in home improvements. Spending on them fell 22% yearly. You can see in the “home improvements” chart above how sharp the decent has been. This is a terrible sign for the health of the consumer and the housing market. It’s worth noting how Home Depot and Lowe’s stocks haven’t fallen with this index; they have rallied with the overall market.
Job Cuts Fall In June & Q2
Much has been made about the spike this year in job cuts probably because the other labor reports such as the BLS monthly report and the weekly jobless readings have been relatively strong. Layoff announcements can be thought of as a leading indicator because the announcements occur before they happen. The spike is no longer happening, so the bears don’t have that point to add to their thesis.
As you can see in the chart below, the number of job cuts in June fell from 58,577 to 41,977.
(Click on image to enlarge)
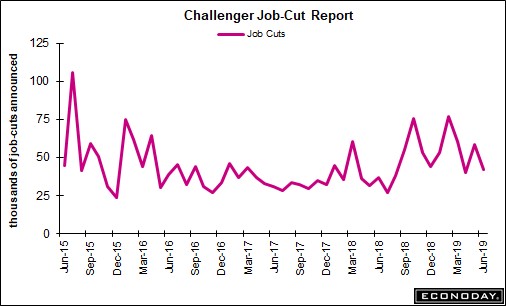
This report is highly volatile and can be manipulated by a few big companies. That’s why it’s best to look at quarterly averages. In this case, it tells us the same thing as quarterly cuts fell 26% in Q2. There were 190,410 cuts in Q1 and 140,577 cuts in Q2. On the other hand, year to date cuts are still up 35% from last year as this is the highest first-half total since 2009. As you can see below, the biggest spike in the past 4 years occurred early in the 2nd half of 2015.
Weakest Non-Manufacturing PMI Since July 2017
According to the ISM non-manufacturing PMI, the services sector is in a slowdown. As you can see from the chart below, in June the PMI fell from 56.9 to 55.1 which missed estimates for 55.8 and was the weakest reading since July 2017.
The #ISM Non-Manufacturing Index has fallen to its lowest level since July 2017, but remains at a reasonably high level. pic.twitter.com/l9lvAu3xPS
— jeroen blokland (@jsblokland) July 3, 2019
This reading is decently below the 12 month average of 57.9. Even though this PMI is above the manufacturing PMI, it’s actually consistent with a lower GDP growth. That might be because the economy has grown to rely more on services for growth in the past few decades. This PMI is consistent with 2.3% GDP growth. Even with this decline that’s still higher than the median estimate of 1.7%.
The business activity, new orders, and employment indexes fell 3, 2.8, and 3.1 points to 58.2, 55.8, and 55. The business activity and new orders indexes have been in a positive trend for 119 months. This expansion is about to be 121 months old at the end of July, making it the longest one since the 1800s. Unlike the manufacturing report, the non-manufacturing prices index was up 3.5 points which means the nominal index improved.
Technically 5 of the 10 comments in the ISM report include the word tariffs, but the wholesale trade quote where it states, “The continued restructuring of ocean-carrier routing is still causing havoc in the supply chain”, is probably related to the trade war as well. The trade deal with Mexico will help this report in July as Mexican tariffs were mentioned once.
The most interesting quote came from a management of companies and support services firm which stated, “The suppliers we do business with are ‘claiming tariffs’ to justify price increases. While some of these issues could be credible, it’s our opinion that this issue provides cover to increase margins, as few will detail the line-item impact.” It’d be interesting if some firms are benefiting from the trade war by claiming tariffs are increasing prices when they aren’t.
Improved Markit PMI
Unlike the ISM report, the Markit services PMI improved from 50.9 to 51.5. The May reading was a 39 month low. This index had a big improvement in the 2nd half of the month as the flash reading was 50.7. That means the index was 52.3 in the 2nd half. That’s a 1.6 point improvement. Remember, the manufacturing component was up 1 point in the 2nd half. Services output growth was the 2nd slowest since August 2016 (the slowest was May).
The US service sector continued to expand in June via 2 survey updates. The Services PMI rebounded, rising after May's 39mo low but the data reflects 'subdued growth': https://t.co/azJBQZZYPs ISM Mfg Index for June offers a brighter outlook for the sector https://t.co/A7uBmoDgJN pic.twitter.com/pMM8s2Wegw
— James Picerno (@jpicerno) July 3, 2019
Just like in manufacturing, new business and new export orders from abroad rose quicker than they did domestically. Total new orders still increased at the 2nd slowest rate since April 2017. Services firms had the weakest business confidence since June 2016. Backlog accumulation growth hit a 3 month high. Employment was in line with the 2019 average and inflation was historically subdued. Markit expects 1.5% GDP growth in Q2 which is slightly below the consensus.
Improvement In ADP Report
The June ADP report showed improvement, but small business job growth remained weak. Specifically, the May report was revised higher from 27,000 to 41,000. The June report improved to 102,000 jobs created, but that missed estimates for 140,000 and the low end of the estimate range which was 130,000. There were 23,000 jobs lost by small businesses.
The chart below shows the 6 month moving average of small business job creation is about 0.
The #ADP survey shows a big deterioration in employment growth at small firms, but there's no evidence that this was a *leading* indicator in earlier cycles pic.twitter.com/WPq3m6m8Qz
— Capital Economics - US (@CapEconUS) July 3, 2019
There were -37,000 jobs created by very small businesses (1-19 employees) and 14,000 created by other small firms (20-49). Midsized firms added 60,000 jobs and large firms added 65,000 jobs. Construction firms hemorrhaged 18,000 jobs and education & healthcare firms added 55,000 jobs.
Conclusion
Home improvement construction has been cratering and the construction industry is hemorrhaging jobs. Job cuts are up year to date but fell in Q2 from Q1. The service sector PMIs weren’t terrible. The ISM reading fell and the Markit reading had a mini increase in the 2nd half of the month. The ADP report showed job creation improved in June, but it was still brought down by small businesses.
Disclaimer: Please familiarize yourself with our full disclaimer here.


