
XRP/USD: Did The Bitcoin Inspired Momentum Expire?
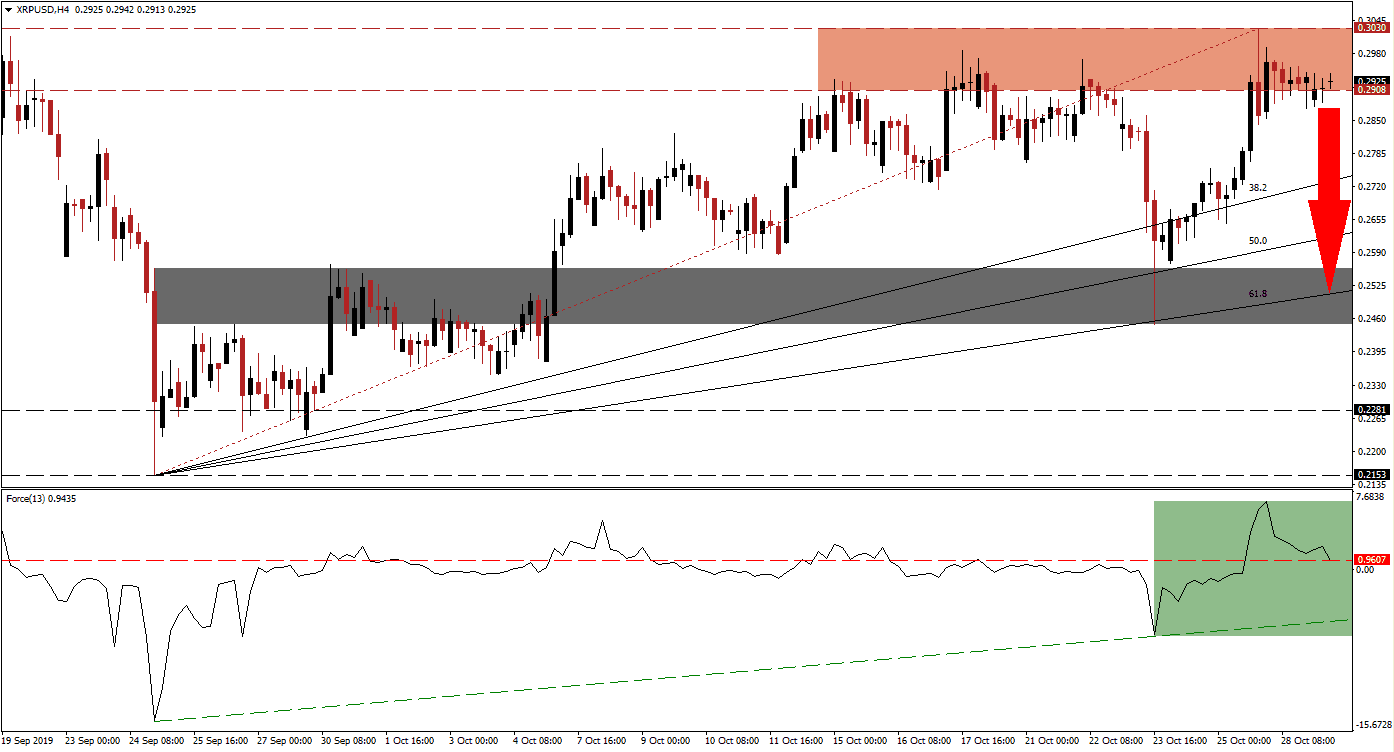
After the cryptocurrency market received a strong bullish momentum boost from Bitcoin’s 4th best daily performance on record last week, the euphoria sparked by Chinese President Xi’s comments on the importance of blockchain technology abated. XRP/USD was able to extend into its resistance zone from where bearish pressures are mounting. A profit-taking sell-off is likely to follow which can push price action back into its 61.8 Fibonacci Retracement Fan Support Level which last week halted a reversal, resulting in an advance leading to a higher high.
The Force Index, a next generation technical indicator, confirmed the higher high in price action with a higher high of its own. The long-term uptrend in XRP/USD remains dominant, but a short-term reversal is expected to materialize. The Force Index already retreated from its peak and is now in the process of completing a breakdown below it horizontal support level, turning it into resistance; this is marked by the green rectangle. A sustained move lower could provide the necessary spark and trigger a short-term sell-off which is expected to result in a higher low, a bullish development.
Due to the strength of the resistance zone, located between 0.2908 and 0.3030 as marked by the red rectangle which also includes the psychological 0.3000 resistance level, a breakout remains unlikely unless a fundamental catalyst emerges. Traders should now monitor the Force Index as a confirmed breakdown below its horizontal support level will additionally place this technical indicator into negative territory, and bears in charge of price action. Any corrective phase in the XRP/USD should keep the long-term uptrend intact.
Since XRP/USD recorded its intra-day low of 0.2153 which now represents the starting point of the Fibonacci Retracement Fan sequence, the advance in price action was well supported by it. This trend is expected to remain in place due to the strong fundamentals behind Ripple and a price action reversal should be limited to the ascending 61.8 Fibonacci Retracement Fan Support Level. This level is currently passing through the short-term support zone which is located between 0.2449 and 0.2559 as marked by the grey rectangle, a breakdown below this zone is not expected.
XRP/USD Technical Trading Set-Up - Breakdown Scenario
- Short Entry @ 0.2930
- Take Profit @ 0.2525
- Stop Loss @ 0.3050
- Downside Potential: 405 pips
- Upside Risk: 120 pips
- Risk/Reward Ratio: 3.38
In the event of a reversal in the Force Index, XRP/USD may attempt a breakout above its resistance zone. The previous breakout attempt resulted in an intra-day high of 0.3213 which was quickly reversed and traders should pay attention to this peak, a sustained push higher is expected to lead to a bigger advance. The next resistance zone is located between 0.3418 and 0.3653 which would also close a previous price gap.
XRP/USD Technical Trading Set-Up - Breakout Scenario
- Long Entry @ 0.3220
- Take Profit @ 0.3550
- Stop Loss @ 0.3100
- Upside Potential: 330 pips
- Downside Risk: 120 pips
- Risk/Reward Ratio: 2.75
(Click on image to enlarge)
Disclosure: DailyForex will not be held liable for any loss or damage resulting from reliance on the information contained within this website including market news, analysis, trading signals ...
more

