
Within Striking Distance Of Record Highs, S&P 500 And Nasdaq 100 Give Out Signs Of Fatigue
Major US equity indices are a stone’s throw away from their respective highs. Daily momentum indicators are extended. Breakout retests are the path of least resistance.
The FOMC meets this week. A 25-basis-point cut to a range of 175 to 200 basis points is priced in. This follows a reduction of similar magnitude in July, which was the first cut since December 2008. After this, two more meetings are scheduled this year – one each in October and December. The odds of another 25-basis-point cut by the end of the year are currently just over 50 percent.
The Fed is in a bind, as data continue to come in mixed.
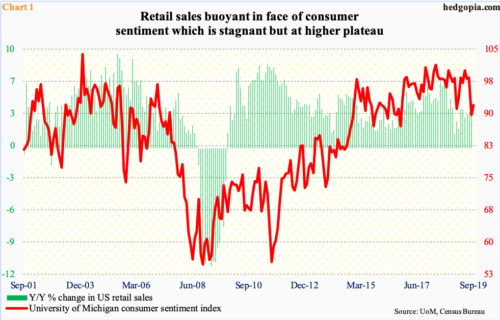
Even the hitherto strong job market is decelerating, with a monthly average creation this year of 158,000 non-farm jobs versus last year’s monthly average of 223,000. Despite this softening, retail sales are hanging in there. In the 12 months to August, sales rose 4.1 percent – a 10-month high. Preliminarily, the University of Michigan’s consumer sentiment index in September increased 2.2 points month-over-month to 92. Since November 2016, except for August’s (this year) 89.8, readings have been in the 90s or 100s (Chart 1). Historically, this is a strong showing. US stocks are near record highs, and that must be helping sentiment.

Stocks are holding their own. From the yield perspective, they are beginning to compete with bonds. The difference between what stocks are yielding and the 10-year Treasury rate has narrowed significantly. Two decades ago, the dividend yield for S&P 500 stocks lagged the 10-year rate by more than 500 basis points. On the 3rd this month, the 10-year rate (1.9 percent) fell intraday to 1.43 percent, much lower than what stocks were yielding, giving stocks a boost. Now, they are on par, give and take (Chart 2).
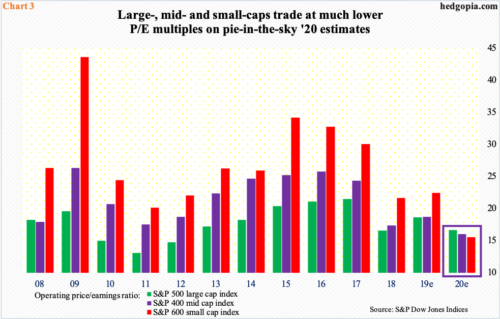
Multiples accordingly remain elevated. Chart 3 plots the operating P/E – both trailing and forward – for S&P 500 (large-cap)/400 (mid-cap)/600 (small cap) companies. Using ’19 blended estimates – $161.56, $104.95 and $43.56, respectively – they currently trade at 18.6x, 18.7x, and 22.4x, which are not cheap. Using ’20 numbers, multiples improve quite a bit – 16.6x, 16x and 15.6x, in that order. But next year’s estimates look very optimistic.
The US economy is in its 11th year of expansion. If next year’s estimates come through, S&P 500 companies would have grown earnings 12.1 percent to $181.11, S&P 400 companies 17 percent to $122.80 and S&P 600 companies 44 percent to $62.74.
For bulls, this pie-in-the-sky optimism is a medium- to long-term issue. Near term, stocks came to life this month after pretty much remaining rangebound throughout August.
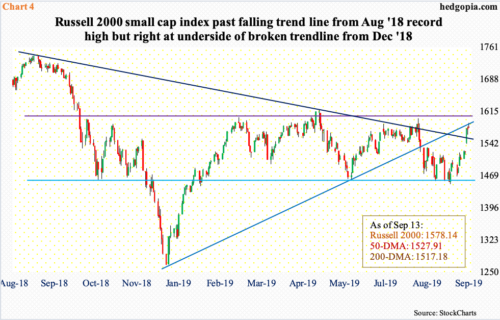
Last week, the Russell 2000 (1578.14) shot up 4.9 percent. In contrast, the S&P 500 was up one percent and the Nasdaq 100 0.5 percent. In doing so, the small-cap index not only reclaimed the 50- and 200-day moving averages but also a declining trend line from August last year when it peaked at 1742.09. Bulls needed to clear one more hurdle – a broken rising trend line from last December around 1590 (Chart 4). Friday, in a gravestone doji session, the Russell 2000 retreated from an intraday high of 1589.45. The daily is grossly overbought.
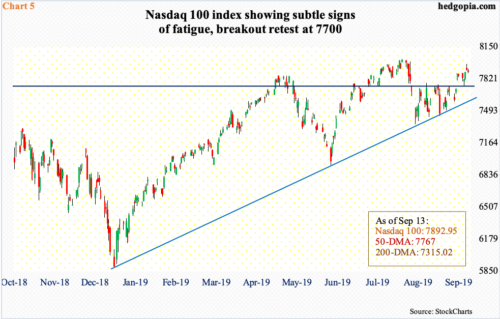
This is also true on the Nasdaq 100 (7892.95). Last Thursday, a shooting star formed just outside the daily upper Bollinger band. This followed a breakout seven sessions ago at 7750. A retest looks imminent. A spinning top developed on the weekly last week.
Structurally, even if bulls lose 7750, which approximates the 50-day at 7767, they can always step up and defend trend-line support from last December. Throughout August, bulls defended this support (Chart 5). Dynamics, however, change if both these levels are breached.
The Nasdaq 100 and the S&P 500 both peaked on July 26 – at 8027.18 and 3027.98, respectively. At last Thursday’s intraday high, they were 0.65 percent and 0.24 percent from those highs, in that order. That is how close they were from setting new records. A last burst is still possible. But increasingly it feels like bulls need to reload, and for that to happen, a sideways to down action is needed.
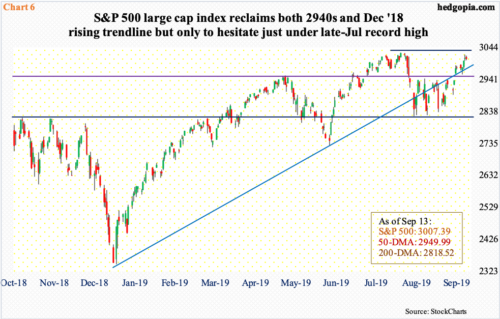
Seven sessions ago, the S&P 500 broke out of 2940s. The 50-day (2949.99) lies right there. Throughout August, the index was essentially rangebound between this resistance and support just north of 2800 (Chart 6). Amidst this, trend-line support from last December was lost and then recaptured. This will get tested at 2960; after that lies breakout retest at 2940s.
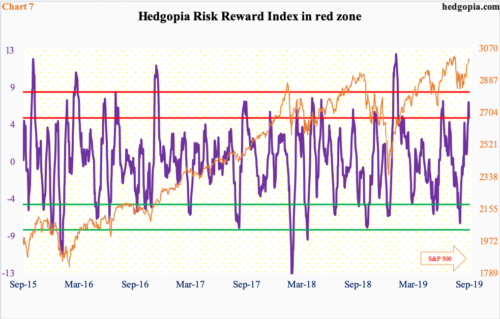
In the meantime, our own Hedgopia Risk Reward Index, which tries to capture short-term swings, entered the red zone last week (Chart 7).
This coincides with extended daily momentum indicators on all three indices above. Unwinding is just a matter of when not if. The path of least resistance is down near term.


