
Wild Data Close To Q1
Today was quite the day for economic data, with two key releases from the Bureau of Economic Analysis (BEA) and Bureau of Labor Statistics (BLS). We’ll start with BEA data on personal income and spending in March.
First, as shown below, the savings rate surged in the month, with households saving 27.6% of personal income net of taxes. That’s a huge number, even by the standards of the elevated savings rates that we’ve seen over the course of the pandemic.

The reason there was so much saving going on is that transfer payments rose by more than $300bn on the month, driven by the delivery of economic impact payments also known as “stimulus checks” or even shorter: “stimmies.”

Incomes also rose thanks to rebounding labor market activity following winter storms in Texas during February and the longer-term trend of reopening across the economy. As shown, the 13.5% annualized growth of wage and salary income in the month was very strong. It was also helped along by wage growth, which we will discuss later on.

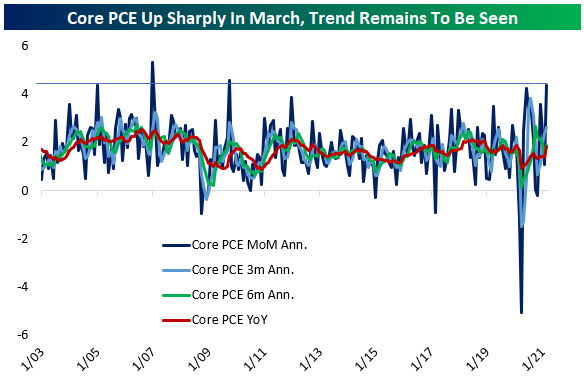
With spending surging thanks to stimulus checks and other factors, core personal consumption expenditure prices surged by the most MoM since 2009, over 4% annualized. The 4% move was in no small part due to the swing in activity from February to March, and isn’t likely to be sustained, but it is a helpful indicator that prices may be more robust in this recovery than they were during the low inflation post-GFC period.
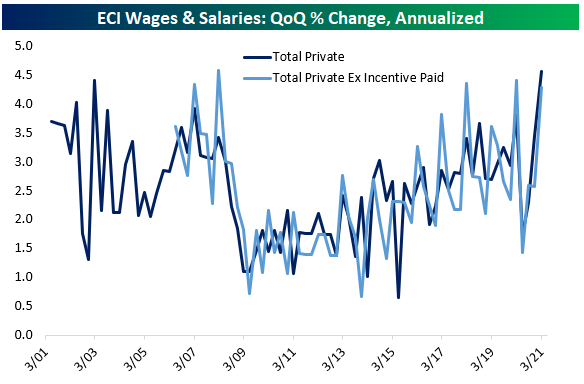
For broad inflation that will concern the Fed, one factor that will be needed along with steadily rising prices is strong wage growth. The second big report today was Q1 wages in the BLS Employment Cost Index (ECI). The ECI does a better job of measuring wage growth than other series because it accounts for changes in the composition of employment over time. As shown in the chart below, Q3 saw the strongest sequential wage growth on record, with a 4.6% annualized advance in wages versus Q4. Some of that came from incentive-paid occupations, which benefit from bonuses and related payments, skewing the results. As shown in the chart, though, there was very strong wage growth even excluding incentive-paid occupations. Anecdotal reports of very tight labor markets amidst booming reopening demand got support from this release.
Click here to view Bespoke’s premium membership options for our best research ...
more

