
Why You Can’t Trust Reported Inflation Numbers
We recently bought a summer house for our family on the Jersey shore. This was not a unique impulse on our part – it is a seller’s market in the worst way imaginable. Having begun our search calmly with no intention of being rushed, we were soon in a bidding war which we “won” — by exhibiting less financial self-discipline than anyone else involved. Within weeks and before we’d closed, our realtor reported that we could assign our contract to another buyer for almost a 10% gain over our price. Bedrooms had already been assigned and additional beach equipment purchased. A quick taxable gain wasn’t enough to counter the prospect of long family faces. Suburban real estate outside New York and many other cities is hot.
Naturally my thoughts turned to Owners’ Equivalent Rent (OER) — the quixotic means by which the government measures housing inflation. Historically, around two thirds of U.S. households own their home (it’s currently 65.8%). Around a quarter of consumer pre-tax income is spent on housing (either owned or rented). Measuring rental inflation is done by surveying actual rents, but for owner-occupied housing, the Bureau of Labor Statistics (BLS) conducts a phone survey in which they ask, “If someone were to rent your home today, how much do you think it would rent for monthly, unfurnished and without utilities?” This is OER.
A house (or an apartment) is a physical asset that provides a service (shelter). The BLS wants to measure the value of the service not the cost of the asset. It’s a sound theory — except that few homeowners spend much time considering the rent they could charge if they vacated their home. OER is a theoretical concept – the only element of the inflation statistics not supported by actual prices.
These are familiar criticisms for those who have studied the issue. BLS statisticians argue that OER reflects all the costs of home ownership, including property taxes, mortgage expense and maintenance, just as the rental cost of an automobile or airplane does. They also argue it’s also not easy to identify an alternative – an index that included mortgage expense and property taxes would incorporate the cost of financing an asset, which they’re not trying to measure.
No cash changes hands based on OER and if it rose sharply, therefore driving inflation higher, would it even matter? The Fed would likely dismiss it as unimportant, a non-cash item. And they’d be correct to. Hiking interest rates because perceived rental income was rising even though nobody was paying those higher rents would seem ludicrous. But since conventional inflation statistics omit the actual cost of shelter incurred by homeowners, the result is that inflation in the biggest portion of consumption expenditures for two thirds of U.S. households is not picked up.
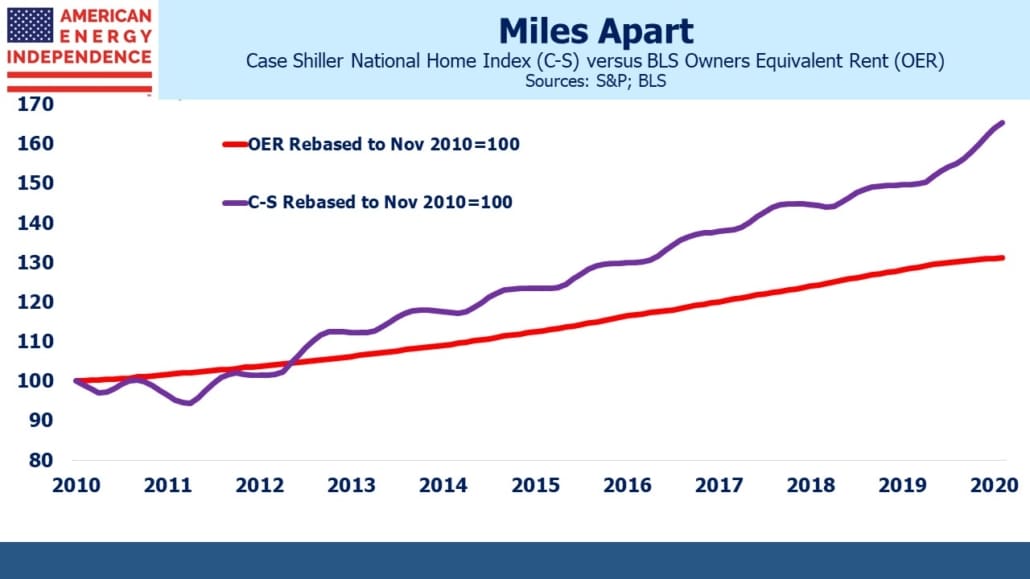
In recent years, OER has lagged the Case-Shiller U.S. National Home Price NSA Index (C-S). Prior to 2000, OER supporters could argue that since OER was tracking C-S it was working, even if their close relationship seemed coincidental given their different methodologies. But since 2000 OER and C-S have deviated, and the gap has steadily widened, as noted in this blog post. Prior to the 2008 financial crisis, OER didn’t show any housing inflation even while actual home prices soared and then slumped. Through December (most recent C-S data), house prices are up 10% year-on-year nationwide, while OER has registered only 2%, less than the five-year average. The most recent OER for February showed a 2% year-on-year increase. Over the last decade, house prices have risen more than twice as fast as OER.
OER doesn’t work.
Most households obtain shelter through buying a home. It’s obvious that house and apartment prices determine the cost of shelter for most of the population, even if buying shelter also requires buying an asset. For the past three decades, the U.S. home ownership rate has remained between 64% and 69%. It’s not that sensitive to prices – many households deem ownership as the only acceptable way of obtaining shelter. Although the BLS statisticians would like us to think of shelter (a service) as separate from an asset (a house or apartment), that isn’t how Americans think. The BLS simply isn’t measuring the cost of shelter in a meaningful way. OER is a flawed concept.
The cost of shelter has risen far more than the 2% suggested by OER over the past year. Using house prices, inflation is really 1% or so higher than reported, even using the Fed’s preferred Personal Consumption Expenditures (PCE) index, which weights OER at 15%. CPI, with a higher OER weighting, would be at least 2% higher. A more representative index would confirm what we already know — inflation is rising.
Because it would make sense to ignore a rise in OER, as it’s a theoretical non-cash expense, and since the Fed doesn’t consider actual home price inflation that affects two thirds of households, it means that inflation in the cost of shelter never impacts monetary policy. A housing bubble led to the 2008 financial crisis, so this is a serious omission that has had negative consequences before. It may again.
It’s often suggested that the government has an incentive to under-report inflation – many transfer payments including social security are indexed. The return on TIPS relies on inflation. Higher inflation automatically drives increased Federal outlays, worsening the fiscal outlook. A government conspiracy to manipulate the numbers is implausible – but it’s also easy to imagine that a junior economist at the BLS contemplating a paper on the weakness of OER might conclude better career moves are available.
Today’s inflation numbers don’t fully reflect the experience of most Americans. It’s time the BLS adopted a more realistic approach.
Disclosure: We are invested in all the components of the American Energy Independence Index via the ETF that ...
more

