
Why Yields Are About To Rise
The mind can be a wonderful tool for self-delusion – it was not designed to deal with complexity and nonlinear uncertainties. Counter to the common discourse, more information means more delusions: our detection of false patterns is growing faster and faster as a side effect of modernity and the information age: there is this mismatch between the messy randomness of the information-rich current world with complex interactions and our intuitions of events, derived in a simpler ancestral habitat – our mental architecture is at an increased mismatch with the world in which we live. ~ Nassim Taleb
Good morning!
In this week’s Dirty Dozen [CHART PACK] we talk about the fulcrum of the entire financial system: YIELDS. We then lay out the case for why they might be about to rise… at least temporarily. We move on to cover signs of rebounding global growth, discuss the state of risk appetite, and end with an airline stock that’s a prime candidate for a squeeze, plus more.
Let’s dive in.
***click charts to enlarge***
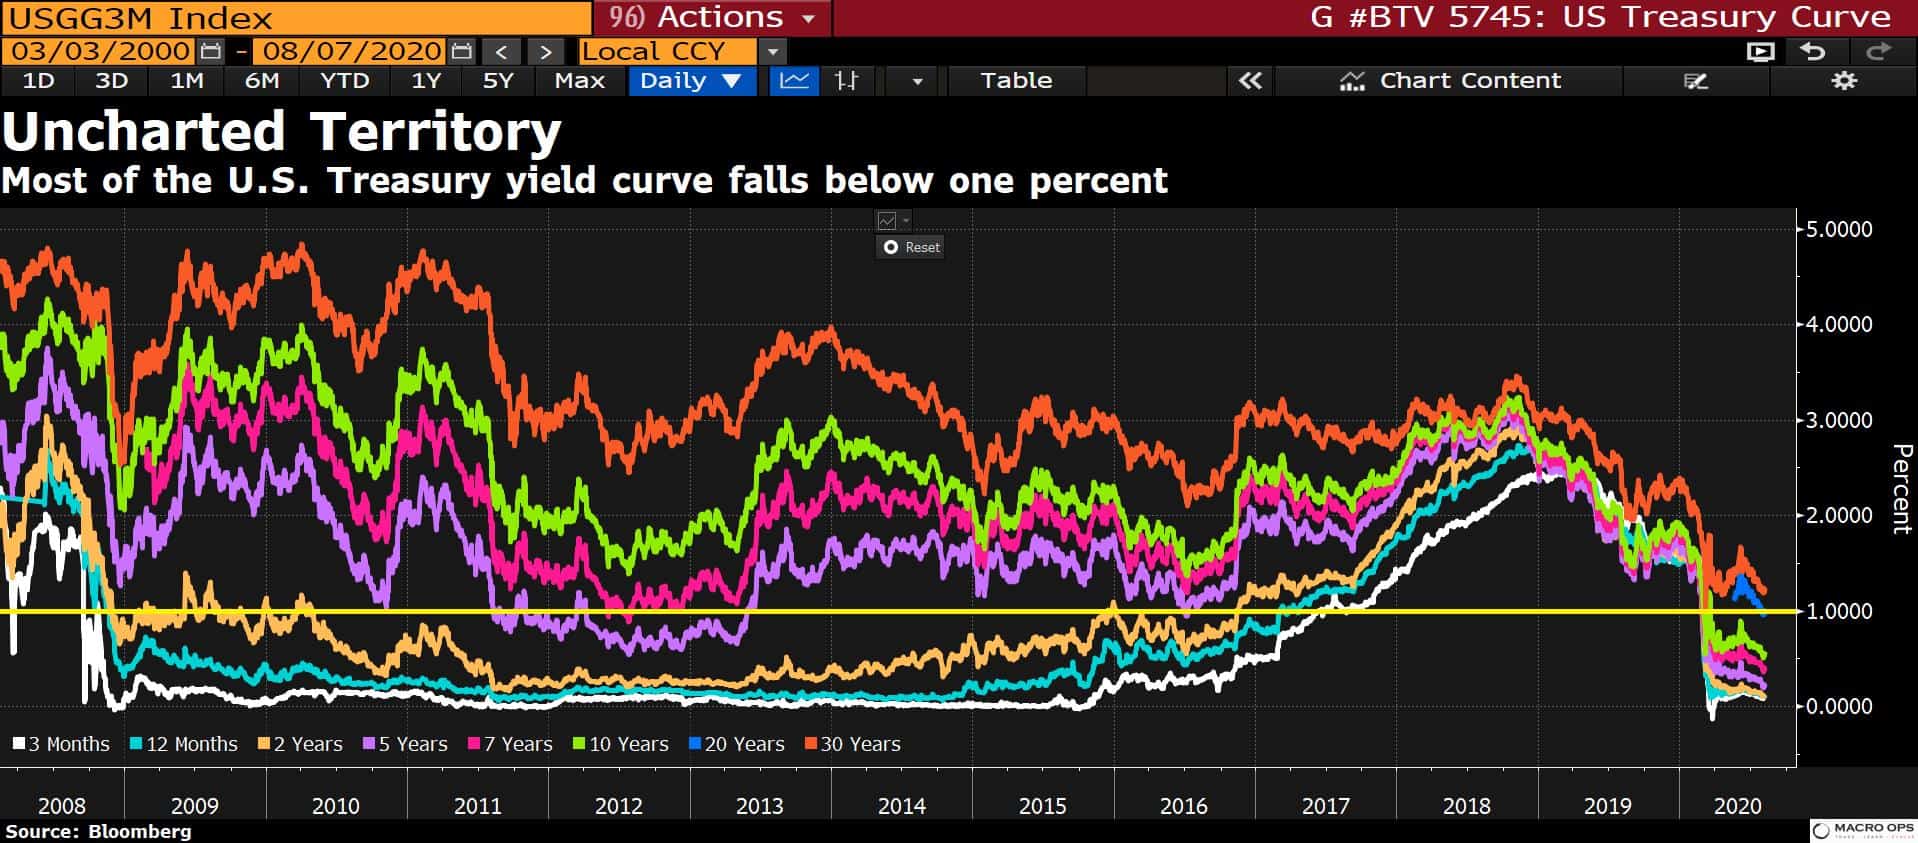
1. US interest rates are the fulcrum of the global financial system. Almost the entirety of this fulcrum, from 3-months out to 30-years, is below 1%. How much further can this trend go? Long-term we’re headed for total yield suppression with full-on Japan-style yield curve control. But it’s not going to be a straight trend from here to there and we’re likely headed for a bump pretty soon…
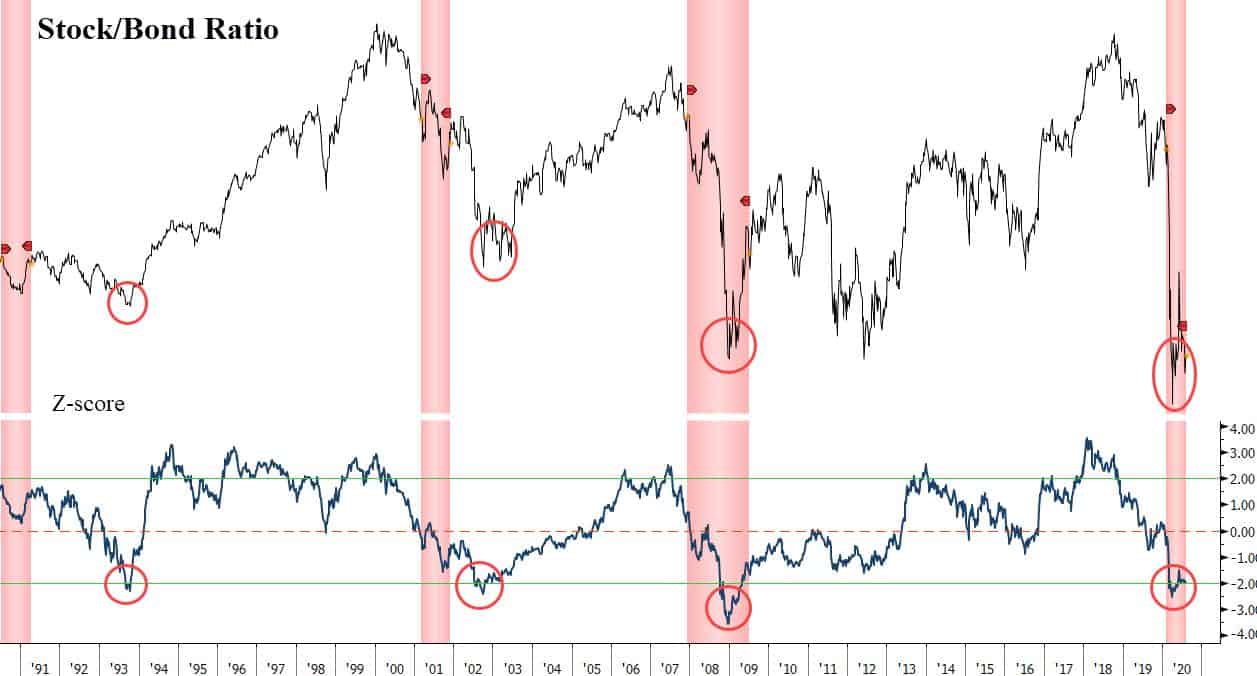
2. Falling yields (bonds up, yields down) have driven the stock/bond ratio to multi-decade lows. Its z-score (red circles) is at levels that have marked major reversals in stock/bond relative performance in the past. Stocks and bonds compete for capital flows. A rotation out of safety and into risk might soon be underway.
3. The bears who’ve been sitting on the sidelines of the equity rally off the March lows don’t understand the financial concept of relativity. Asset allocation is a choice of comparisons that contain a number of critical feedback loops. The rate of change in US Baa yields recently fell to its lowest level since 2003. These levels are more consistent with a major bottom in stocks, not a top.

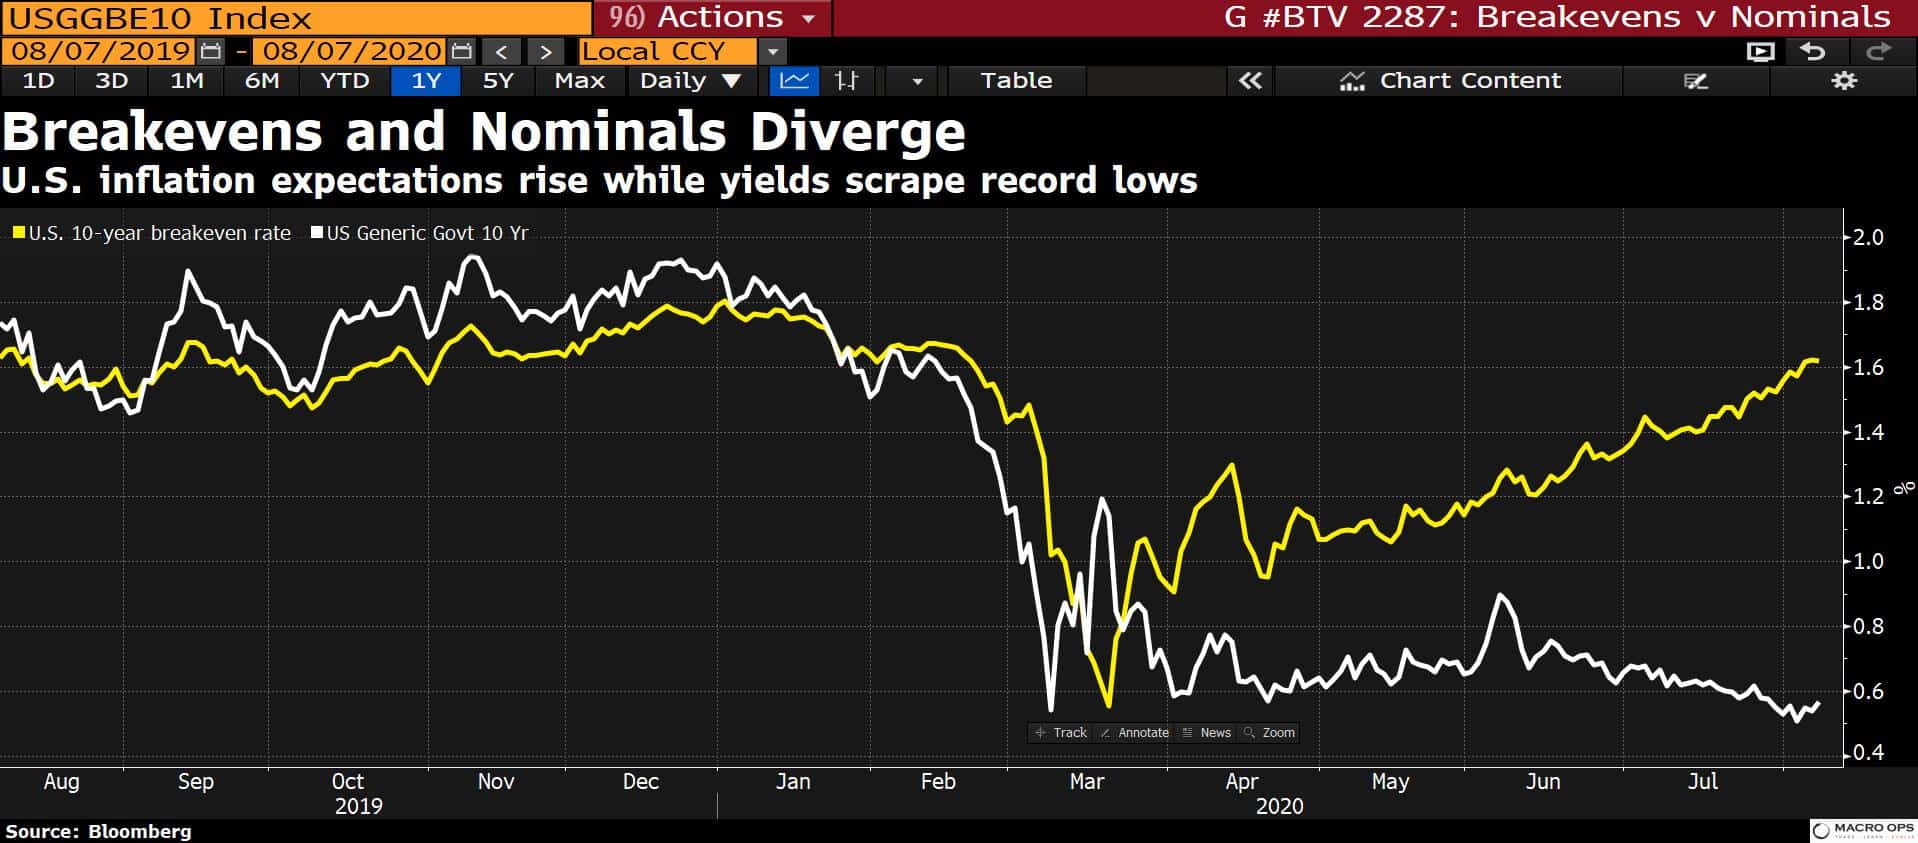
4. But as I’ve been pointing out the last few weeks, it appears there’s a major trend change brewing. The MOVE index (a measure of bond volatility) is at all-time lows. Compression regimes lead to expansionary ones. And there are some growing signs of important divergence. Here’s a chart showing 10yr Breakevens pulling away from UST 10yr yields. Also, keep an eye on cyclical vs. defensives over the coming weeks.
5. What could drive this trend change in yields? Growth and inflation expectations… Or rather, things not turning out as bad as most were expecting them to.
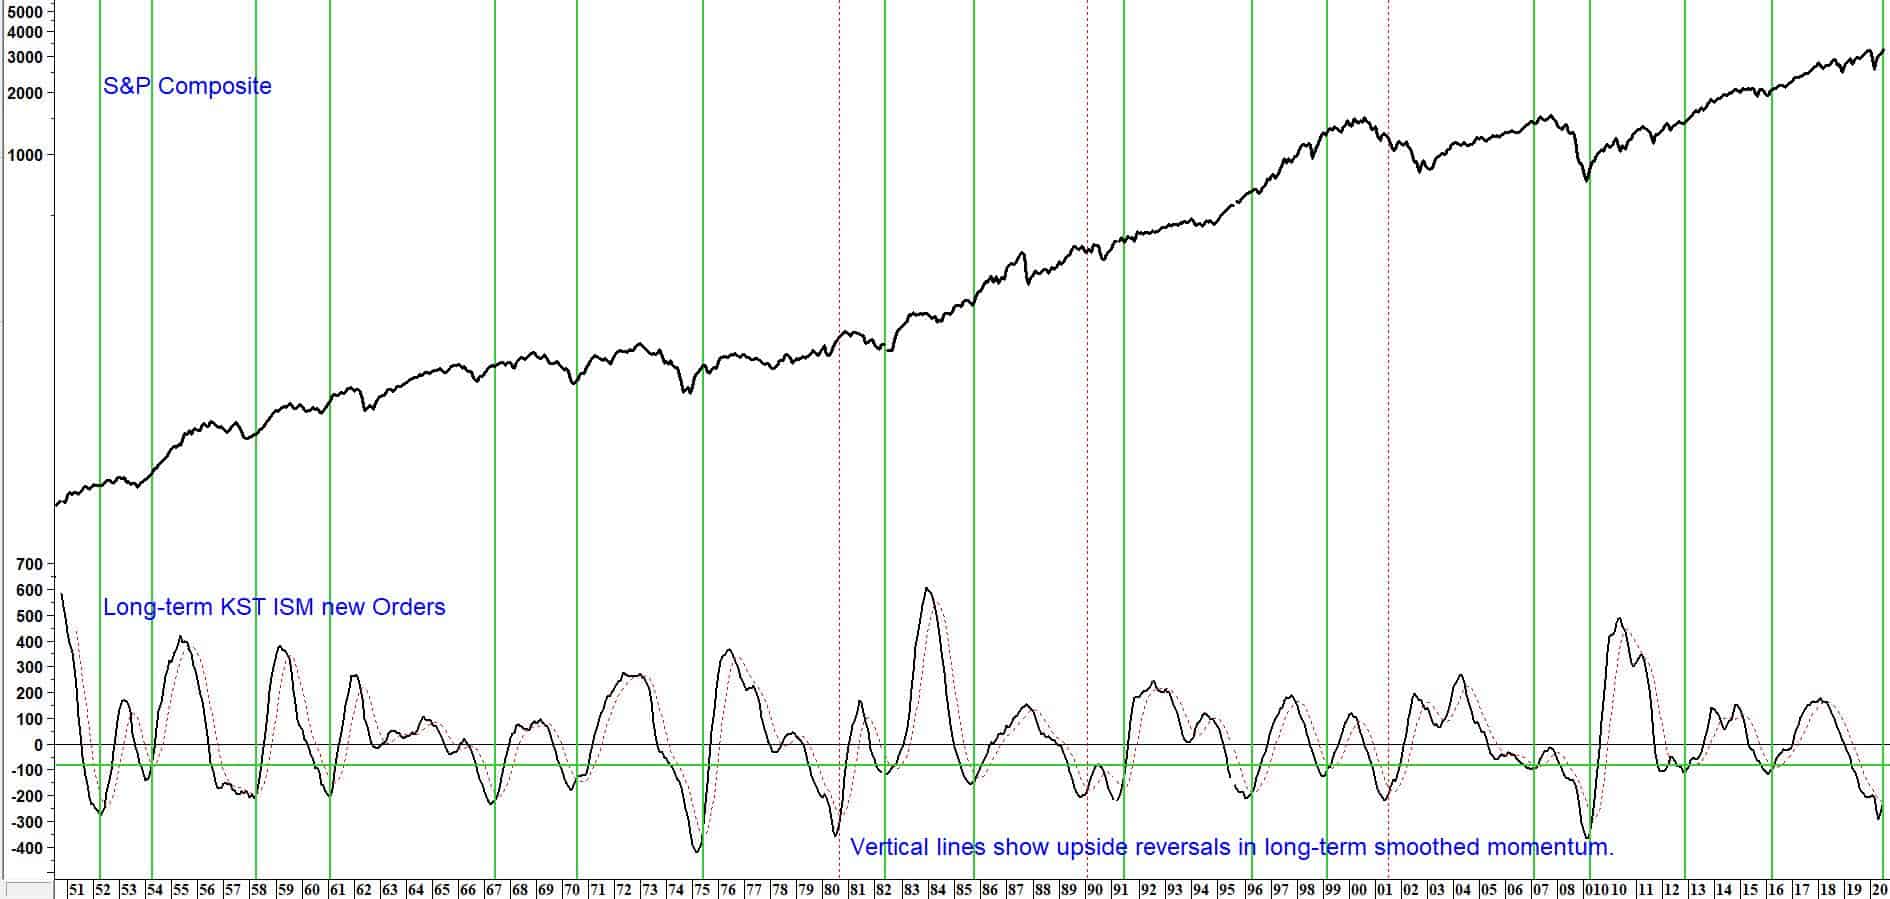
6. Veteran market technician Martin Pring tweeted this chart and wrote: “The long-term momentum for ISM New Orders has turned up. The green vertical lines flag previous examples. The S&P typically celebrates with a nice rally when this happens.”
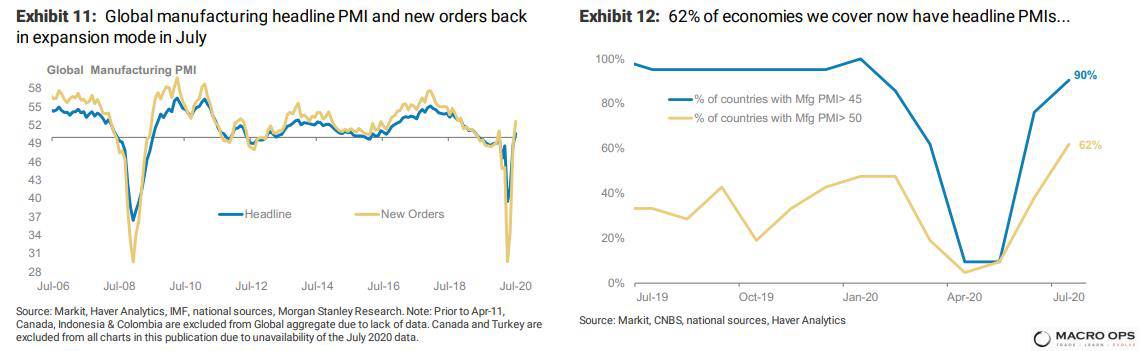
7. Morgan Stanley wrote in a recent report that “The global recovery is progressing well and is transiting from the sharp jump in monthly indicators in May-June to a natural moderation in the pace of improvement since July as we have already made up a lot of lost ground. Retail sales in both the US and EA are already close to or above their Jan-20 peaks; global manufacturing and services PMIs moved back into the expansionary territory in July and electricity consumption is now growing on a YoY basis in EMs ex-China like India and Brazil, which were lagging earlier.”
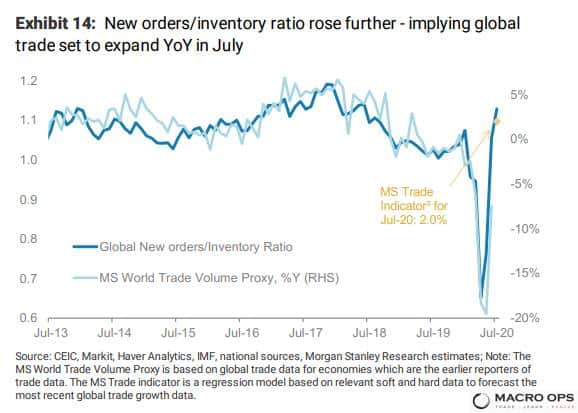
8. While Global New-Orders-to-Inventory-Ratio is pointing to a return to growth in global trade.
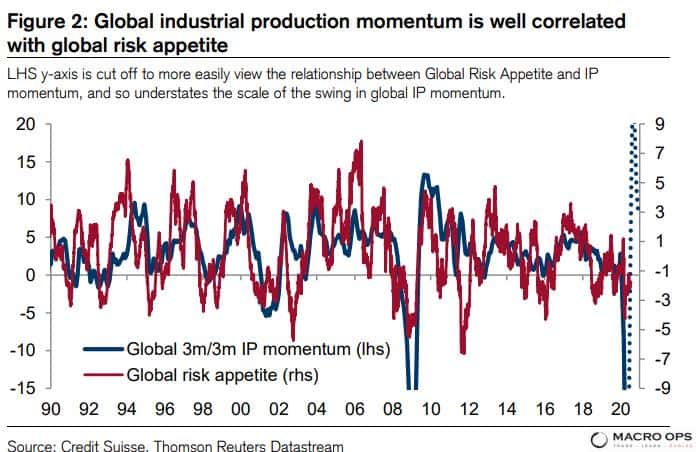
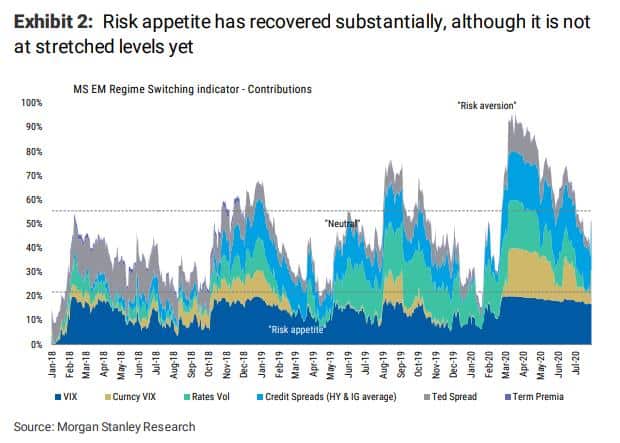
9. Meanwhile, there’s still plenty of room for risk appetite to recover according to MS’s EM Regime Switching Indicator.
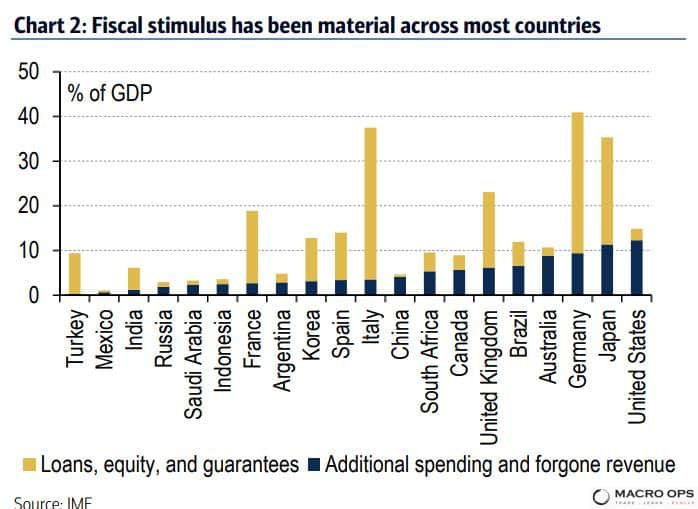
10. We have fiscal to thank for this. This updated fiscal stimulus as a % of GDP chart from BofA shows the enormity of the policy response to date.
11. We’ve been bullish precious metals for a while and ultimately believe they’re headed much higher. But if our intermediate bond thesis plays out, then crowded and extended precious metals should get pinched hard. Gold is now four Std Devs above its 200-week moving average. The last two times it’s been this extended, a sharp drawdown quickly followed.

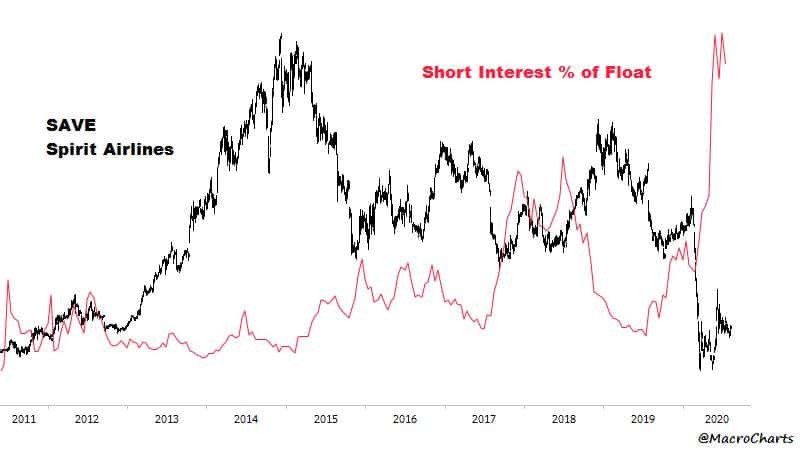
12. With the return of increasing risk appetite, we should see some of the most beaten down and hated stocks pop — putting the squeeze on crowded shorts. Spirit Airlines (SAVE) is one of those candidates (chart via the talented @MacroCharts).
Disclaimer: All statements are solely opinions and are for educational purposes only.


Great read. highly recommended.