
Why Ethereum Might Be Entering Do-Or-Die Time

Ethereum (CRYPTO: ETH) is the second-highest market cap cryptocurrency behind Bitcoin (CRYPTO: BTC).
The entirety of the cryptocurrency market has seen a correction in the past couple of months and these cryptos were likely the pioneers leading the dip in the market. Ethereum is now nearing some important price levels that can be shown on the chart.
Ethereum was down 3.4% at $2,526 at the last check. Below is a technical analysis as Ethereum enters a critical time.
(Click on image to enlarge)
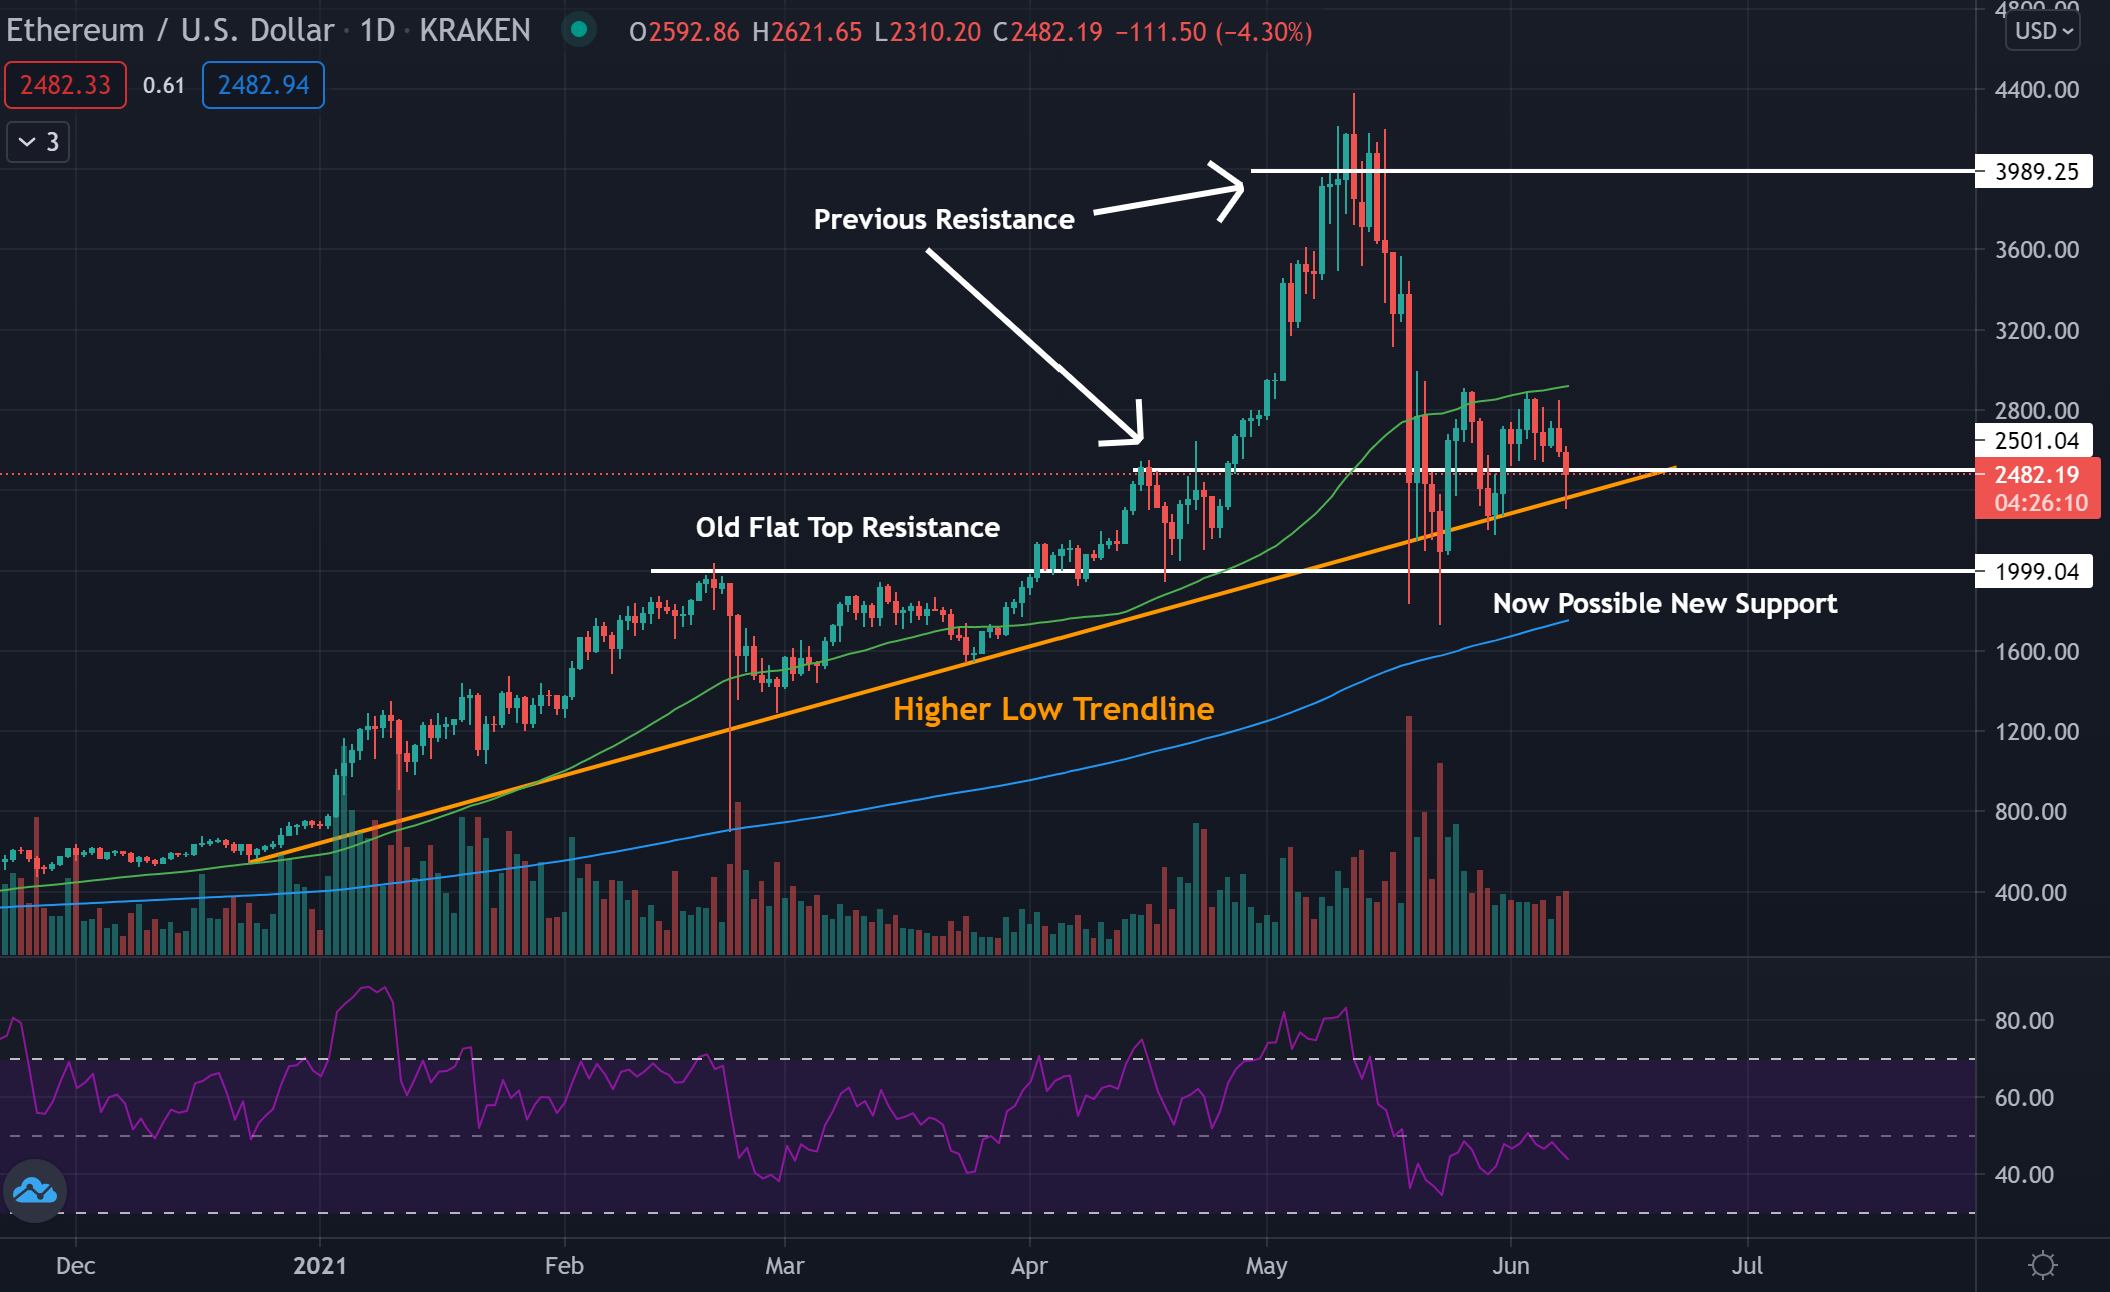
Ethereum Daily Chart Analysis:
- Ethereum is falling back toward the trendline and is nearing a key support level.
- The crypto is trading below the 50-day moving average (green), but above the 200-day moving average (blue). Indicating the crypto is likely consolidating.
- Ethereum may find resistance near the 50-day moving average and support near the 200-day moving average.
Key Levels To Watch:
- Ethereum has been falling recently and is now hugging the higher low trendline, as well as a previous resistance level near $2,500.
- The Relative Strength Index (RSI) shows that Ethereum cracked below the center line of 50 and now sits at 44. This means Ethereum is now more oversold than it is overbought and a possible sign of weakness traders should take note of.
- If Ethereum were to keep climbing, it may find a strong resistance near the $4,000 level.
- If Ethereum were to break support and fall below the trendline, it may not find support until the $2,000 mark.
What’s Next?
Bullish technical traders would like to see Ethereum hold the higher low trendline to continue the uptrend. If the price can stay above the $2,500 level while maintaining the higher low trendline, this will add a more bullish outlook to the situation.
Bulls would like to see the RSI move back above 50 to show there are more buyers than sellers. Maintaining higher lows and breaking the $4,000 resistance is the long-term goal for bulls.
Bearish technical traders would like to see Ethereum firstly stay below the $2,500 level, and then break below the higher trendline. Bears would also like to see the RSI move deeper into the oversold territory.
A long-term goal for bears would be to see Ethereum drop to the $2,000 trendline before breaking below and potentially plunging further.
© 2021 Benzinga.com. Benzinga does not provide investment advice. All rights reserved.


