
Who Let The Doge Out And Where Is The Cryptocurrency Headed Next?

(Photo: Dogeloverforever on Wiki Commons)
An investment of $1,000 in Dogecoin (CRYPTO: DOGE) on Jan. 1, 2021, would be worth a whopping $67,600 as of 12 p.m. Friday.
Dogecoin, the popular meme cryptocurrency, has been on a tear recently with Tesla Inc (Nasdaq: TSLA) CEO Elon Musk pumping it almost daily. On April 1, he tweeted he planned to send “a literal Dogecoin to the literal moon." Dogecoin probably won’t go to the actual moon, but using Fibonacci retracements can help crypto traders and investors to get an idea of where the price may end up.
Fibonacci levels use percentages, calculated from Fibonacci numbers, to indicate where support and resistance levels may be on a chart. They can be especially useful for determining future price action when cryptocurrencies and stocks are in all-time highs and there is no price history to indicate support and resistance levels.
The Dogecoin Chart: Dogecoin has been in all-time highs since April 13 when it reached $0.0939 after which it rose to, and then consolidated in, the $0.13 range before completely breaking out Thursday afternoon. By Friday morning, Dogecoin had climbed to a new all-time high of $0.4486.
Although there is no price history to find support and resistance levels on the Dogecoin chart, now that it has made a low and a new high a Fibonacci retracement tool can be used to determine what might happen next.
When Dogecoin hit $0.19 at 3 p.m. ET Thursday, it entered into a period of consolidation for three hours before making a higher low of $0.168 at 7 p.m. The higher lower is used for the first point for the Fibonacci retracement.
Dogecoin then went parabolic, running 167% to $0.4486 over the following 14 hours before starting another round of consolidation. The top of the move can be used for the second point for the retracement.
At 8 a.m. Friday, Dogecoin rejected from the golden pocket, the 0.618 to 0.65 level, before busting through it and topping out. By 1 p.m. Dogecoin and consolidated and retraced to 0.382 which is considered healthy consolidation. Dogecoin's consolidation also created a bull flag pattern on the one-hour chart.
The upper Fibonacci levels, the 1.27, 1.67, and 2, above the current price show possible areas of resistance if Dogecoin goes on another run higher. The Fibonacci levels below the current price show possible levels of support if Dogecoin drops lower.
(Click on image to enlarge)
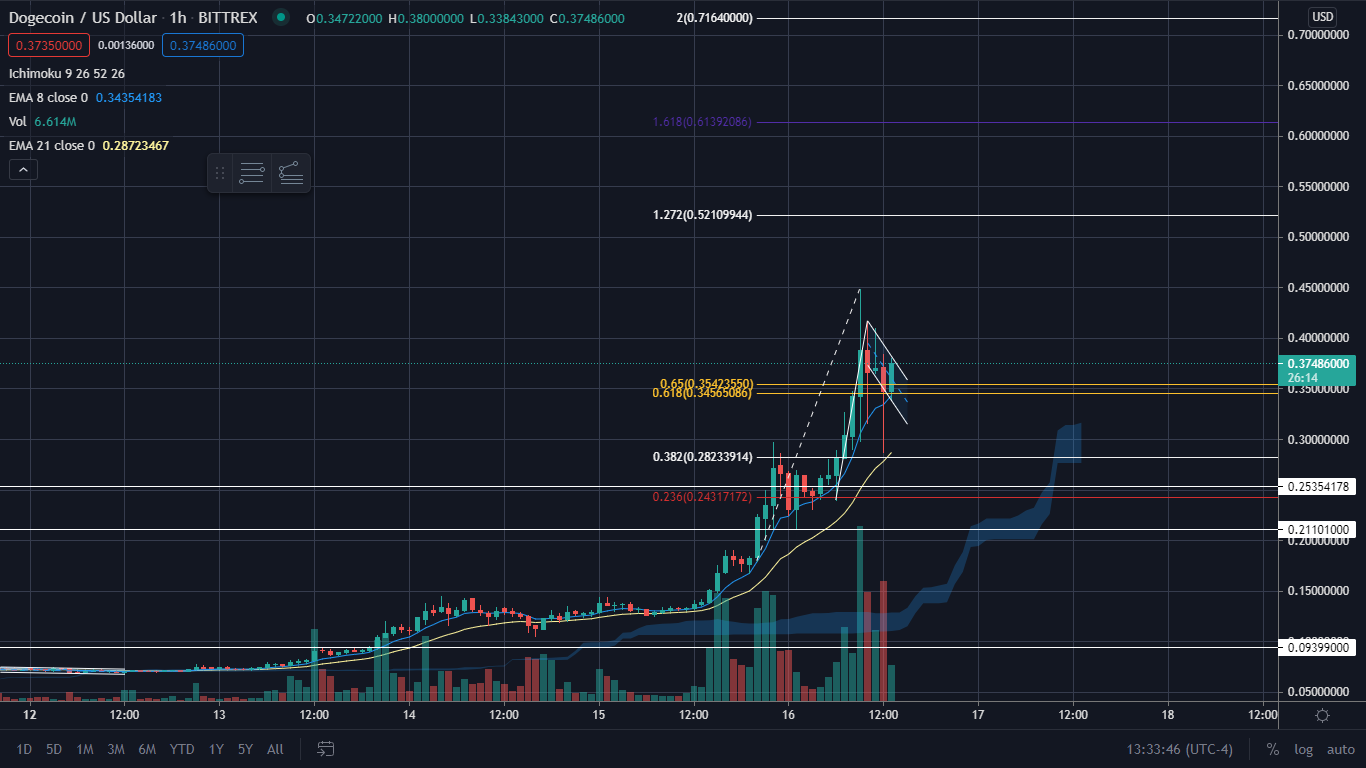
Bulls want to see Dogecoin make another big move to get over the 1.27 level. If it can reach this level, the chances of it reaching the next two levels go up. Reaching level 2 would likely be an area with a lot of profit-takings.
Bears want to see a close under the golden pocket to see a retest of the 0.382 level. If that level of support, which also aligns with some hourly price action support, Dogecoin could retrace to the 0.236 area. A loss of that support could mean the end of this bull cycle for the meme currency.
Disclaimer: © 2021 Benzinga.com. Benzinga does not provide investment advice. All rights reserved.


