
Who Is Buying Bonds With Negative Yields? JPMorgan Answers
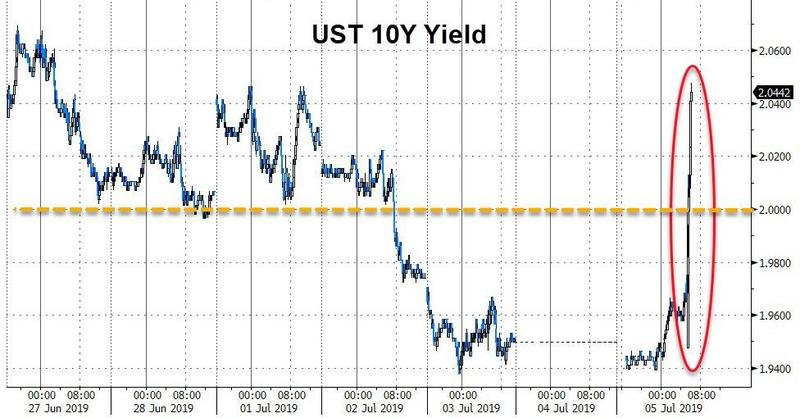
ack in June, when bond duration hit an all time high and total negative yielding debt hit a record $13.4 trillion for the first time (it recently spiked to $17 trillion), we warned that a "monstrous" VaR shock loomed as all bond investors had been forced on the same side (the deflationary) of the boat. It didn't take long for this prediction to start coming true: just 48 hours later, following a much stronger than expected June payrolls number which beat every sellside forecast, 10Y Treasury yields exploded higher in a 6-sigma move that saw massive paper losses for those who were long the curve as government bond yields soared.
Indeed, as JPM said at the time, "the rise in bond volatility coupled with very strong momentum and elevated positions was raising the risk of a large bond selloff or tantrum."
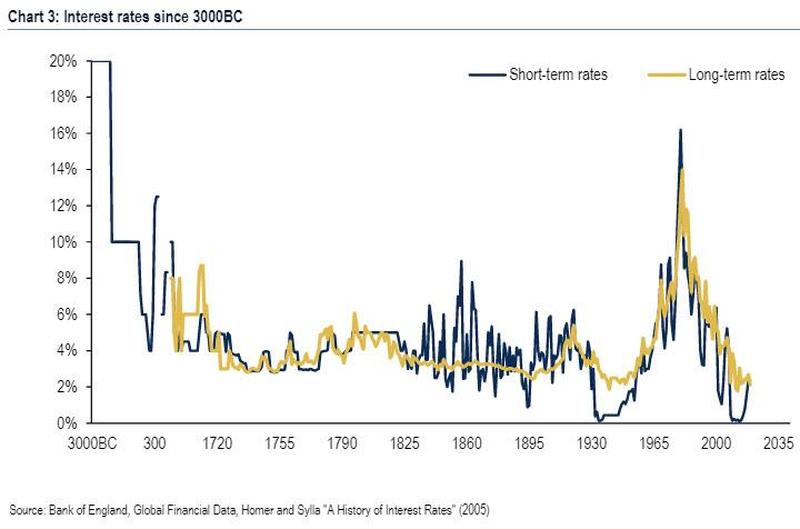
And yet, something odd happened after: even though bond volatility surged, and vol-sensitive investors such as hedge funds, mutual fund managers and risk parity funds cut their duration positions as the Value-at-Risk exceeded their limits and stop losses are triggered, the widely anticipated bond selloff didn’t materialize in the summer despite the VaR shock as an unexpected re-escalation of the US-China trade war on August 1st renewed the bond rally with the yield on JPM's Global Government Bond Index falling by another 30bp during the month of August. Crushing conventional wisdom, the yield on global debt dropped to new 5000-year lows (if only those Roman emperors had cut rates more)...
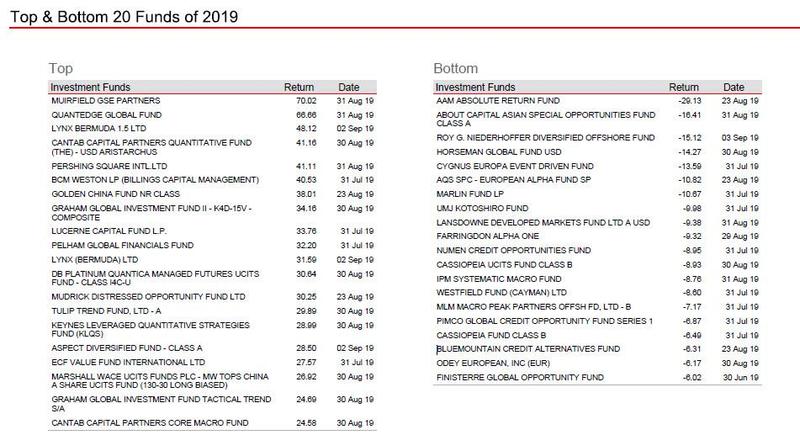
... even as a major cross-section of the bond investing public puked, resulting in a bloodbath for bond shorts, while as we noted last week, vol-insensitive CTAs benefited from the relentless momentum in the bond market, which resulted in CTA and momo funds - which trade based on trends and momentum chasing - to be the best performing group, returning 19.41% YTD.
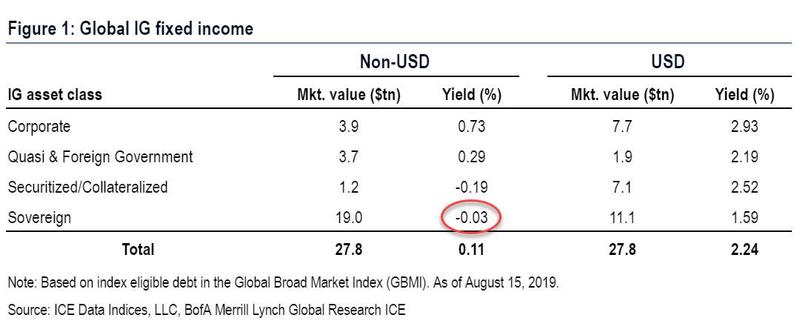
Meanwhile, bond yields continued to sink ever lower, and as recently as two weeks ago BofA calculated that the average non-US sovereign bond yield had turned negative for the first time ever, sliding to -0.03%.
Which leads us to two key questions:
i) who is buying bonds with negative yields, and ii) has the bond rally in August made bond markets more or less vulnerable, or in other words, is the risk of a bond tantrum or VaR shock higher or lower relative to last July?
Conveniently, these are the two questions asked by JPMorgan's Nikolaos Panigirtzoglou in his latest Flows and Liquidity. who first addresses the recent surge in bond volatility, and the July VaR shock, noting that "when the volatility shock arrives, VaR sensitive investors cut their duration positions as the Value-at-Risk exceeded their limits and stop losses are triggered. This volatility induced position cutting becomes self-reinforcing until yields reach a level that induces the participation of VaR-insensitive investors, such aspension funds, insurance companies or households."
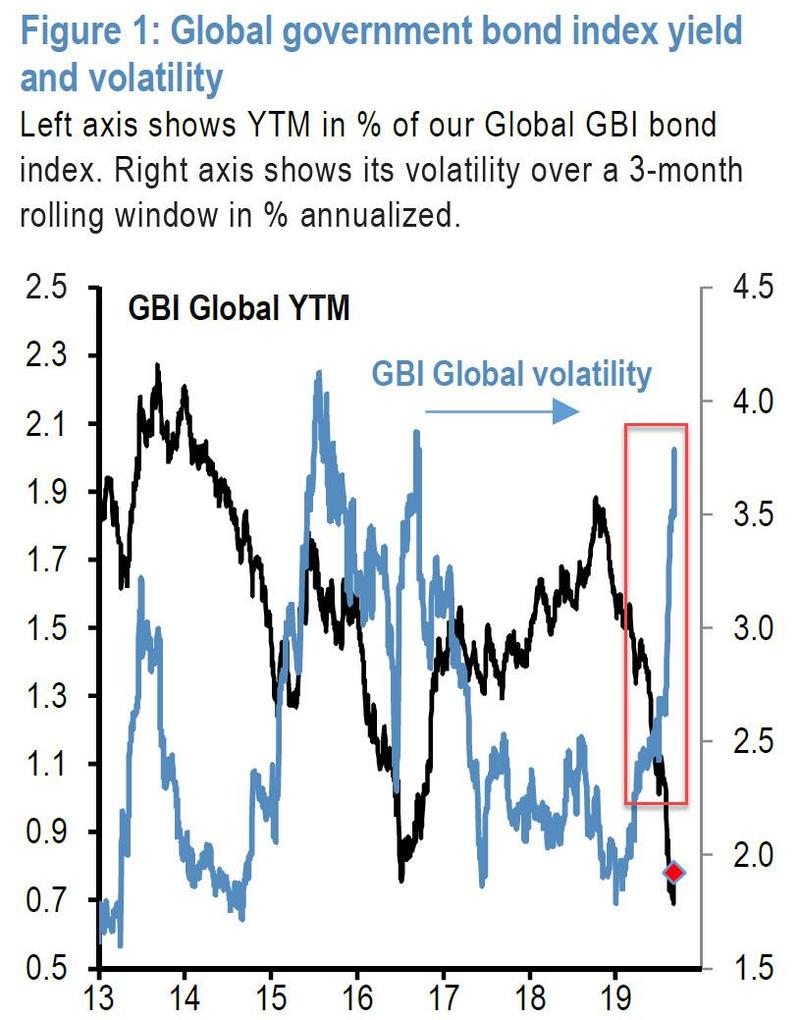
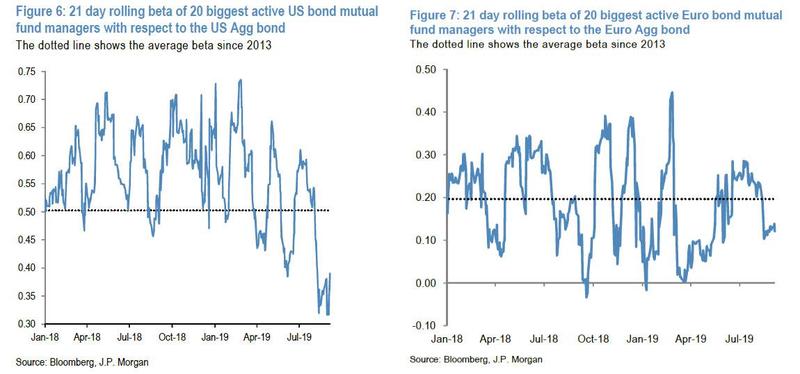
A common feature of bond tantrums or VaR shocks is that bond volatility starts creeping higher ahead of the shock, which once unfolded causes volatility to spike to even higher levels. As shown in the chart above, bond volatility has been creeping up for months now and rose further in recent weeks to very high levels currently, last seen immediately after the US presidential election of 2016 or during the Bund tantrum of early 2015. As Panigirtzoglou writes, "this sharp increase in bond volatility must have already put some pressure on VaR sensitive investors to cut their bond positions." And indeed, some position indicators such as the betas of active bond mutual fund managers appear to have declined over the past month.
This in turn goes to address the first question - who was buying bonds as yields plumbed record lows, as it suggests that the bond rally in August was largely driven by VaR insensitive investors such as insurance companies and pension funds rather than VaR sensitive investors. The chart above also provides a partial answer to the second question, because according to JPMorgan, given how high bond volatility is at the moment, there is higher chance that bond volatility subsides rather than rises from here, pointing to lower likelihood of a VaR shock currently relative to last July.
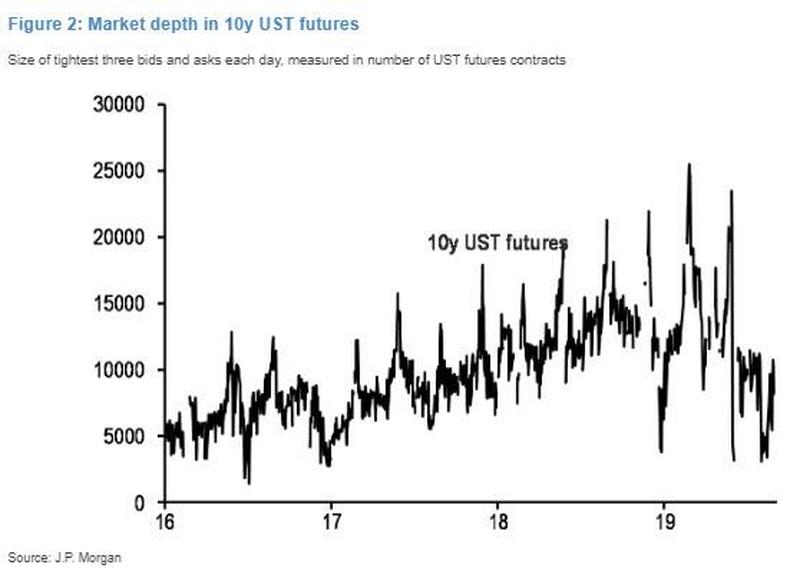
A second common feature of previous bond tantrums or VaR shocks was a rapid deterioration in market liquidity ahead of the shock. And sure enough, there is clear evidence of further deterioration by looking for example at JPM's market depthproxy for 10y UST futures shown in the next chart: "this market depth measure, based on the size of the tightest three bids and asks each day measured in number of contracts, has unwound this year much of the previous improvement seen during 2017 and 2018. And more recently this measure declined further posting a multiyear low in mid-August."
A third feature of previous bond tantrums or VaR shocks was position vulnerability by VaR sensitive investors such as hedge funds and asset managers including CTAs who are active participants in futures markets. Here, as Panigirtzoglou writes, telative to last July, the evidence on investor positioning is more mixed.
1) Movements between government bond yields and the HFRX Systematic Diversified CTA index have almost mirrored each over the past months and this continued to be the case in the most recent weeks. This is shown in the next figure, which depicts a CTA performance index against the average of 10y UST and Bund yields.
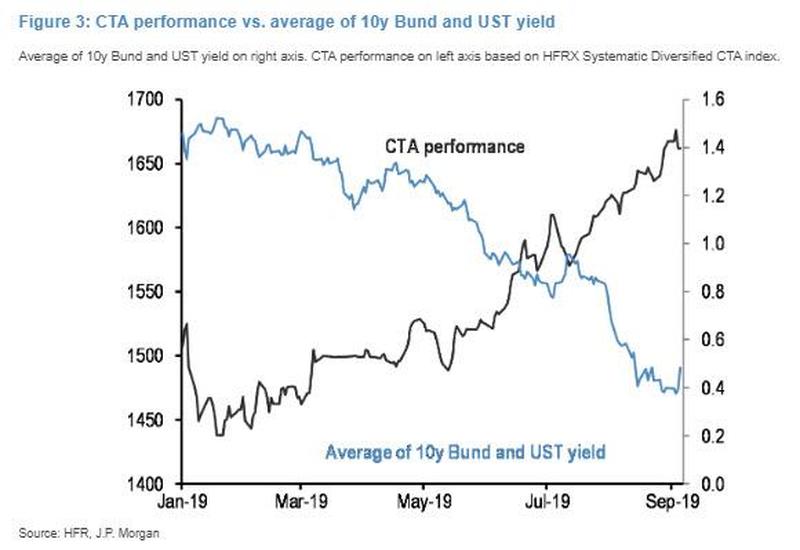
The CTA performance index spiked over the past months suggesting that CTAs have been increasingly benefiting from the bond rally, something we noted last week when we highlighted the stellar performance of CTA investors in 2019. A continued overhang of long duration positions by CTAs is also implied by JPM's momentum signals for 10y TSY and Bund futures as shown in Figure 4.
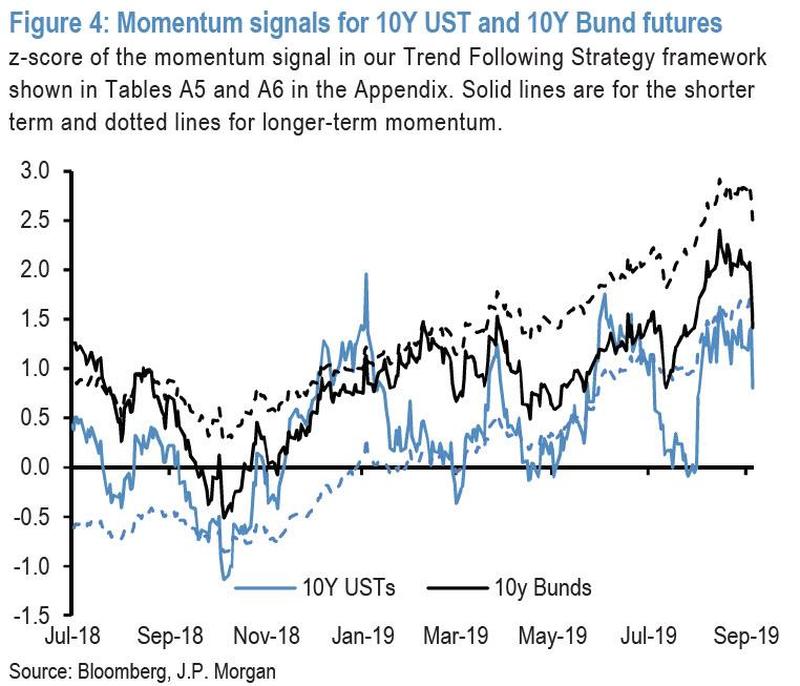
These momentum signals had been rising up until the end of August to high levels for USTs and very extreme levels for Bunds. The change in momentum over the past week or so has already started putting downward pressure on these momentum signals suggesting that CTAs and other trend following investors might come under pressure to reduce their very elevated bond positions, unless of course bonds get a fresh wind in their sails following Friday's surprisingly poor jobs report.
2) The evidence on real money managers is more mixed: JPM's European client survey, which tends to be less volatile and to exhibit clearer medium-term trends than its US counterpart, showed another large increase in the long duration exposures by our clients over the past month. The current long duration positioning based on the latest survey on August 29th is now matching the previous highs seen in April 2015 ahead of the Bund tantrum at the time.
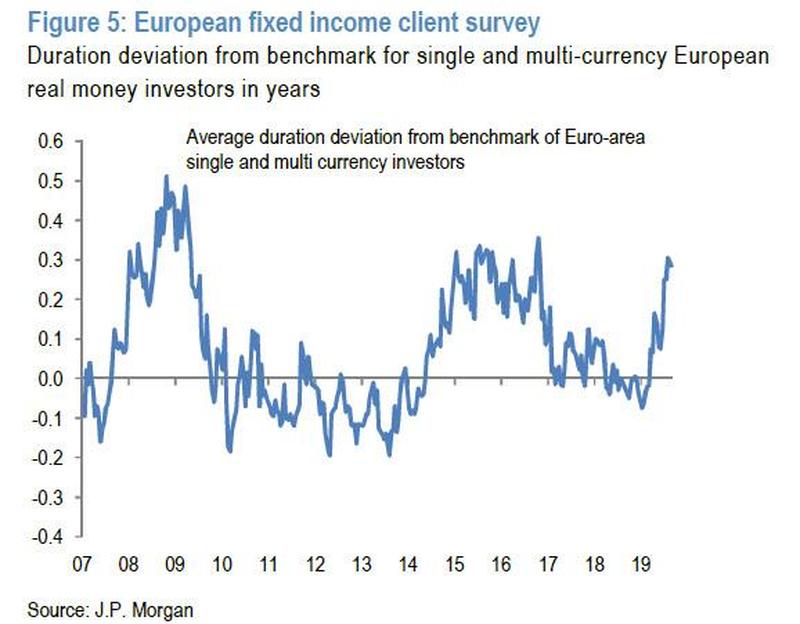
Yet if one looks at the biggest active bond mutual fund managers relative to aggregate bond indices, a different picture emerges. The effective total duration of these bond managers declined in August as shown by Figure 6 and Figure 7, pointing to below rather than above average total duration exposure, especially in the US. This suggests that it is also possible that the rise in bond volatility in August put pressure on VaR-sensitive investors such as bond mutual fund managers to cut their duration positions last month. So if one combines Figure 5, Figure 6 and Figure 7 we conclude that real money managers are currently not as long duration as they were in July.
Putting the above evidence together, JPM concludes there is now a lower risk of a bond tantrum relative to what we saw last July; it would also suggest that the probability of even lower rates is greater than a violent snapback higher in yields.
Which brings us to the main question: who will be buying bonds at already record negative yields?
As JPM notes, with bond yields during the month of August having seen new lows after a rally triggered by the escalation of the US-China trade conflict from end-July, the universe of negatively yielding bonds expanded sharply. Indeed, negatively yielding bonds in the Bloomberg Global Agg index reached a new high of $17tr, or just over 30% of the index by market value.
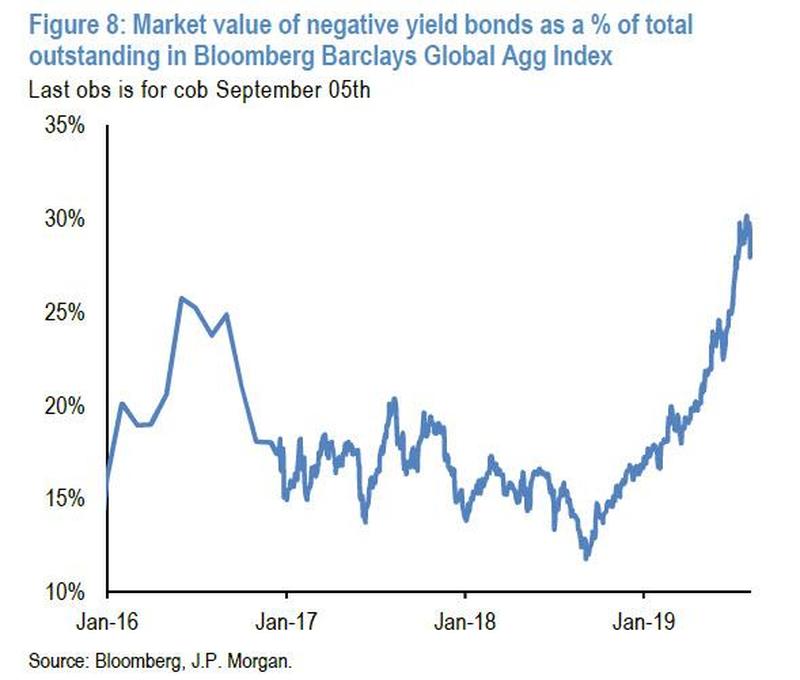
Furthermore, as discussed here and elsewhere, the steady rally in yields has seen the entire yield curve of several countries trading at negative yields. This, as even JPM notes, "has again raised questions about who buys bonds with negative yields?"
Here, JPM's Panigirtzoglou notes that there are in fact a number of investor groups that buy bonds with negative yields; these include:
- investors that fear or expect deflation;
- investors that speculate on currency appreciation;
- investors that expect capital gains resulting from central bank easing;
- central banks themselves, particularly when conducting asset purchase programs;
- indexed or passive multi-asset and bond funds;
- banks who seek to avoid potentially even more negative deposit rates;
- foreign investors who may find negatively yielding bonds attractive after FX hedging is accounted for;
- CTAs and other momentum-based investors who are price-based rather than yield-based investors; and
- some insurance companies and potentially pension funds that may be forced by regulations to de-risk or reduce duration mismatches even as yields turn negative.
Here, the JPM strategist focuses on the latter three as these have generated most discussion in recent client conversations.
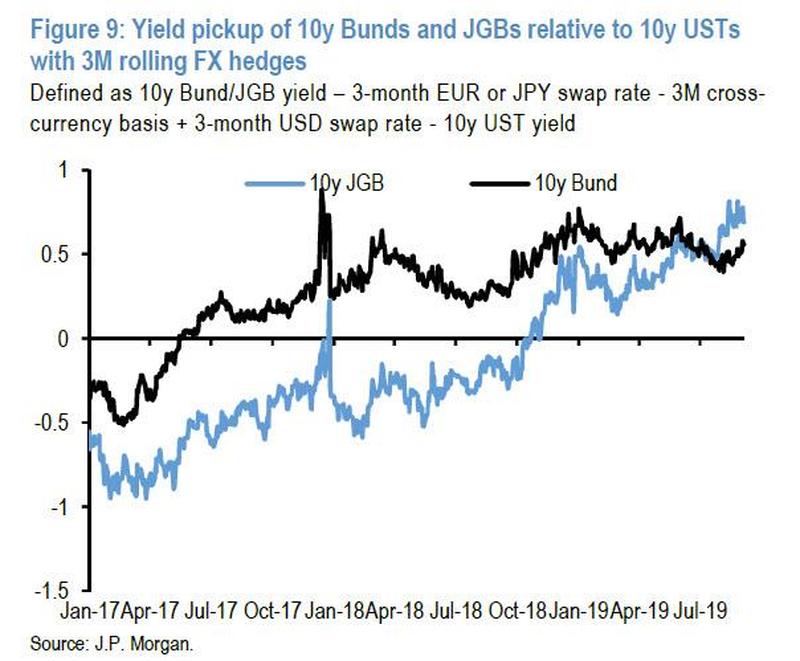
First, looking at foreign investors, these may find negatively yielding Euro area or Japanese bonds attractive, as some investors (e.g. dollar-based investors) take advantage of the cross currency basis as well as differences in funding rates (although not every investor chooses to hedge FX exposure). In this way, US investors can buy a 10y Bund yielding -60bp or 10y JGB yielding -26bp and still provide yield pickup of 55-70bp over 10y US Treasuries. This is shown in Figure 9, which depicts the 10y UST yield as well as 10y Bund and JGB yields currency hedged to US dollars using 3-month rolling hedges. In addition, Euro area investors can achieve around 55bp of pickup in 10y JGBs vs. 10y Bunds after currency hedging to maturity, while Japanese investors can achieve around 30bp of pickup in negatively yielding 5y Spanish bonds vs. JGBs.
Indeed, foreign investors have been ravenously buying Euro area and Japanese bonds this year, despite nominal negative yields. On aggregate, the ECB and BoJ balance of payments data show foreign investors have bought nearly $210bn of Euro area (of which around $130bn of government bonds) and $70bn Japanese bonds in the first half the year. The significant inflow into Euro area bonds in particular stands in stark contrast to the $550bn of sales by foreign investors from March 2015 when the ECB started its QE purchases to December 2018, and while it not straightforward to quantify the inflow from US investors, it can account for a substantial part. Moreover, German bonds, which saw cumulative outflows of nearly $360bn from March 2015 to December 2018, have seen inflows of more than $65bn in the first half of 2019. Of this, May and June accounted for a combined $22bn even as 10y Bunds have been trading with increasingly negative yields. The inflows into Japanese bonds on an annualized basis were also stronger than the $80bn per year on average since 2015.
This is a longish way of saying that when factoring for FX hedging, the fact that the US has positive nominal yields means little when they net to even lower yields when FX hedged vs Europe or Japan.
Meanwhile, CTAs and other momentum-based investors are price-based (i.e., they care for capital appreciation) rather than yield-based investors, and as shown in Figure 9 above, this momentum has strengthened since 10y Bund yields turned negative in early May suggesting these investors have been buyers of negatively yielding bonds until more recently. Indeed, the z-score for 10y Bunds has doubled since early May, suggesting the size of positions may also have doubled.
Finally, some insurance companies constrained by solvency ratios may be forced to de-risk and buy negatively yielding bonds, even though that assures capital loss through maturity; one loophole - hope that a greater fool emerges (i.e., central bank QE) allowing the insurance company to sell the bond at a capital gain to a third party. Similarly, pension fund with wider funding gaps may be forced by regulators to reduce duration mismatches even as yields turn negative.
Putting the above together, it suggests that in terms of the flow into negatively yielding bonds, foreign investors have been the most substantial influence, and that CTAs and other momentum-based investors have also been an influential flow, but that insurance companies have likely been a more modest influence.
Disclosure: Copyright ©2009-2018 ZeroHedge.com/ABC Media, LTD; All Rights Reserved. Zero Hedge is intended for Mature Audiences. Familiarize yourself with our legal and use policies every ...
more

