
What’s Up With Bitcoin? The Data
With all the talk about Bitcoin, at Cornell Capital Group we thought it is time to delve into the data. The data sample employed in the analysis consists of the daily returns on Bitcoin, the Nasdaq Composite Index, GLD (an ETF that tracks the price of gold), Tesla, and Amazon from January 1, 2015, through January 8, 2021. I also consider a more recent subperiod that runs from March 10, 2020, through January 8, 2021, to determine whether things were different during the recent stock market and Bitcoin booms (other than the fact of the runups themselves). Here I summarize the results of the analysis.
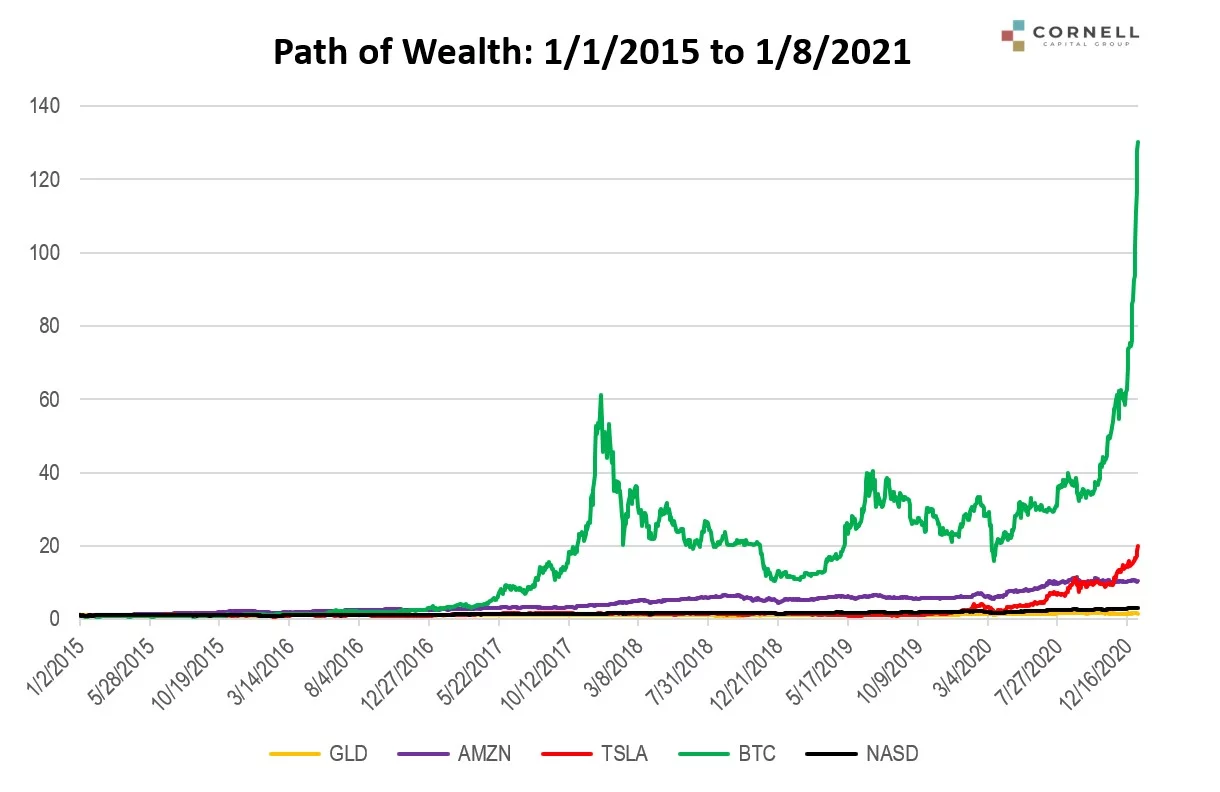
To get started, the first two graphs below use the returns to compute the path of wealth for $1 invested in each of the five assets. The first graph starts on January 1, 2015, the second on March 12, 2020. The first graph appears compressed because of the remarkable performance of Bitcoin. One dollar invested in Bitcoin on January 1, 2015, would have grown to $125 in six years, a compound annual return of 125.5% percent! This dwarfs even Tesla’s 65.0% annual return and makes the return on the Nasdaq of 20.4% appear downright anemic. Gold does not even appear to leave the x-axis, but the annual return is 7.2%.
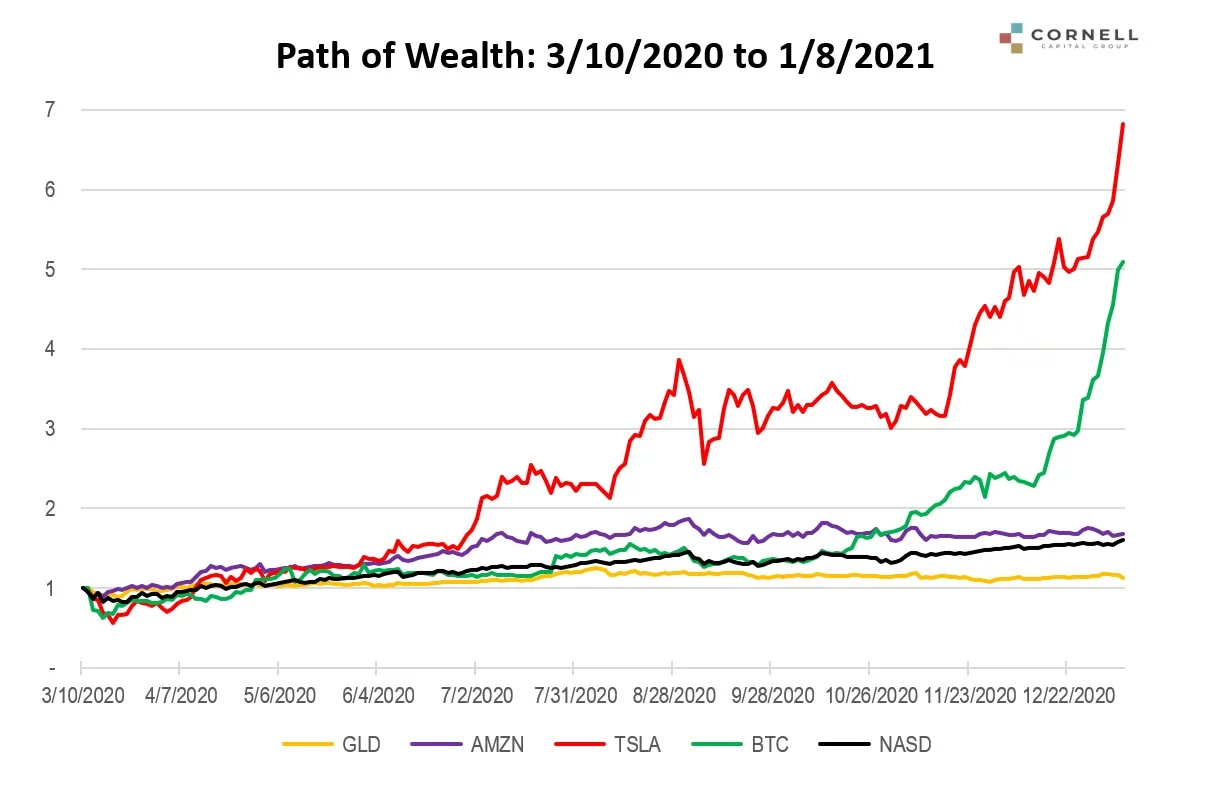
The main difference that emerges in the more recent period is that Tesla joins Bitcoin in the stratosphere with an annualized return of an astonishing 899%, exceeding even Bitcoin’s 604% return.
(Click on image to enlarge)
Volatility
The annualized standard deviation of return for an asset, or its volatility, is a common measure of risk. The long-run volatility for an average stock is about 20%. During the full period, the volatilities for the five assets in the sample were as follows: GLD 14%, Nasdaq 21%, AMZN 31%, TSLA 55%, and BTC 73%. Not surprisingly, the volatilities of TSLA and BTC are exceptionally high. An investor in these assets might well say, “Who cares?” given average returns of 65% and 125%. However, decades of research in finance find that exceptional returns in the past do not forecast exceptional returns in the future, whereas high risk does forecast future high risk.
Correlation
Volatility is not the full story of risk. If assets are uncorrelated, much of the risk can be reduced by diversification. One of the selling points of Bitcoin is that it is allegedly uncorrelated with the market and thereby can be used to reduce the risk of an overall portfolio. Unfortunately, during both the full sample and the subperiod, this turns out to be wrong. With respect to the Nasdaq Index, Bitcoin has a beta of 0.48 in the full period and 0.69 in the subperiod. Both have high statistical significance.
It is also interesting to ask whether the Bitcoin returns are correlated with those of Tesla because the graph shows them moving together. When considered in isolation, there is a small positive correlation between the two, but it turns out this is entirely due to the fact that both move with the market. When the market impact is eliminated using regression analysis, there is no remaining correlation. They appear to move together in a chart, but this is because Bitcoin and Tesla have both been trending up, not due to an underlying correlation between daily returns.
Another asset often tied to Bitcoin is gold. However, the data show that during the times when Bitcoin’s price was exploding there was little relative increase in the price of gold. Unlike Bitcoin, however, gold was uncorrelated with the market during the full period. However, gold was positively correlated with Bitcoin and this positive correlation remains even when the market impact is eliminated. Apparently, there is some common underlying force affecting both Bitcoin and gold, but it is not large in economic terms as evidenced by the divergence between the price charts.
Inflation Hedging
Bitcoin is often touted as an inflation hedge but there is nothing in the recent data to support this view. Inflation was running at just under 2% with little volatility in the period from January 1, 2015, to the present when Bitcoin experienced its massive run-up on high volatility.
The Bottom Line On The Bitcoin Data
The dramatic increase in the price of Bitcoin over the last six years, and particularly over the past year, has been remarkable. However, there is nothing in the data, or economic studies of similar price increases, to suggest it will continue. What can be expected to persist is high volatility. In addition, Bitcoin is more highly correlated with the stock market than is commonly understood. If the market were to reverse, Bitcoin would likely fall too. Finally, there is nothing in the historical record to suggest that Bitcoin is a good inflation hedge. This should not be interpreted to say that it is not a good hedge, but only Bitcoin’s volatility makes it impossible to reliably draw that conclusion from the historical record. For these reasons, Bitcoin investors should be particularly cautious.
For those who would like the further details, email info@cornell-capital.com.
Disclaimer: Cornell Capital Group LLC is a registered investment adviser. Information presented is for ...
more

