
What's Driving The Demand For Listed Infrastructure?
Why listed infrastructure? Let’s follow the logic chain: Equity-market volatility, low fixed-income yields, and increased economic uncertainty all stand as potential stumbling blocks that threaten to derail even the best-laid of plans. Amidst all of this, the value of investments that can offer potential for greater diversification and downside protection—and also serve as additional sources of income as well as opportunities for growth over time—is becoming increasingly clear.
Perhaps nowhere is this more apparent than in the listed infrastructure asset class, which continues to draw the attention of investors seeking to capture its potential benefits in multi-asset portfolios. This is due in part to the increasing mainstream appeal of infrastructure investing, which has evolved significantly since the early 1990s. Back then, the market capitalization of the broad universe of publicly traded infrastructure companies was approximately $500 billion. Today, it stands at approximately $3 to $4 trillion.1 What exactly is powering this increased demand for listed infrastructure? We believe there are six key factors responsible.
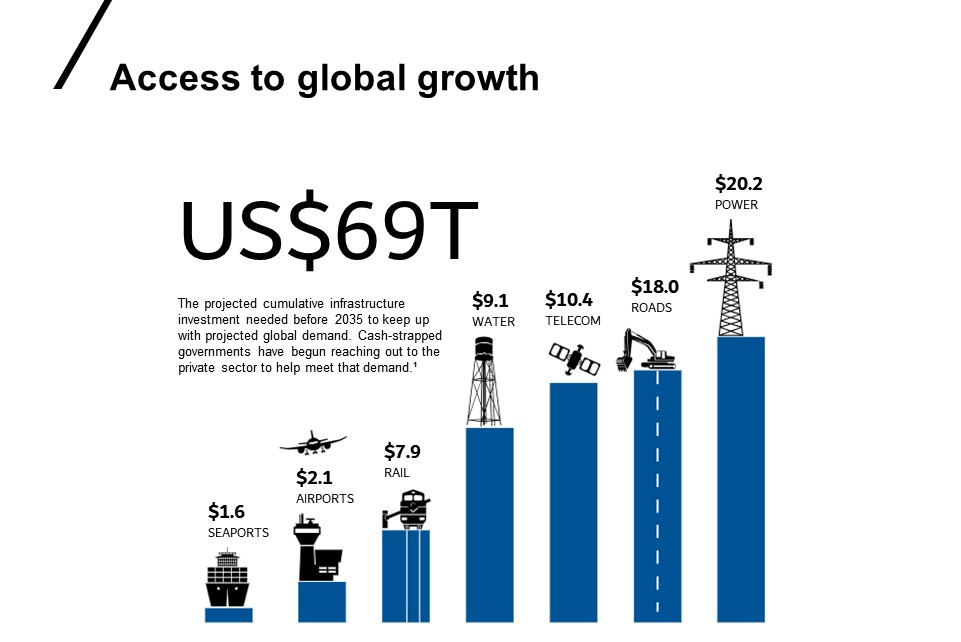
1. Access to a global growth opportunity
Upgrading the world’s infrastructure will likely be a dominant theme over the coming decades. In fact, per a McKinsey Global Institute estimate, a staggering $69 trillion will need to be spent on critical infrastructure by the year 2035 to keep up with projected global demand.2 In addition, given the cash-strapped positions of many governments and municipalities, there’s likely to be an increasing reliance on private capital to finance infrastructure spending needs.
(Click on image to enlarge)
In addition to high-level spending requirements, there are also several structural growth themes at play across the infrastructure investment universe. For example:
Airports: Commercial air travel has witnessed significant growth over recent decades, with total passengers per year increasing from 1.46 billion in 1998 to 3.97 billion in 2017. By 2037, it’s expected that the number of individuals flying on commercial aircraft globally will reach 8.2 billion.3
Wireless towers: Global growth in the demand for wireless data continues at a seemingly insatiable pace. Contributing factors include increased smartphone usage, data-intensive applications that utilize live-streaming and/or video and the rise in mobile banking. Consider that in the U.S. alone, consumers used 82% more mobile data in 2018 than a year earlier.4
Renewable energy: Limiting climate change, reducing carbon dioxide emissions and improving energy efficiency is also creating significant investment opportunities. Bloomberg estimates $11.5 trillion will be invested in new power generation from now through 2050, with a significant portion of that being directed at renewables.5
In each of the examples above, owners of critical infrastructure assets are poised to benefit from positive structural trends. Given that sourcing growth opportunities in this late-cycle economic environment has become increasingly challenging, infrastructure presents a compelling choice.
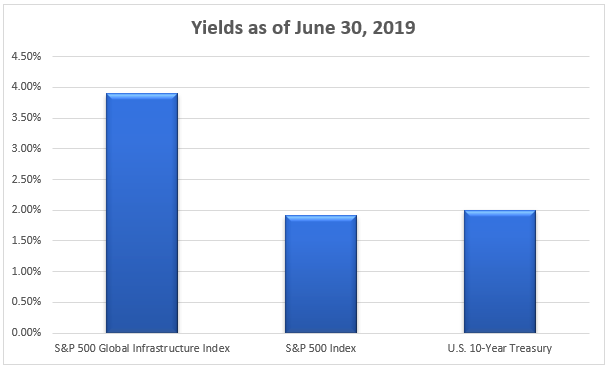
2. Enhanced yield potential relative to equities and bonds
While infrastructure investments have historically provided a relatively high dividend yield, just as importantly, they’ve also exhibited predictable and resilient cash flows. This cash flow resiliency across differing economic environments, as well as the ability to generate a steady income stream, is due to the fact that infrastructure assets provide essential services and typically operate in monopoly-like competitive positions.
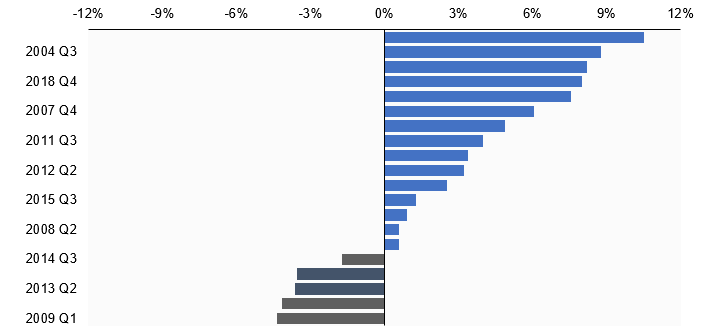
3. Diversification and downside protection
As a defensive alternative to equities, exposure to infrastructure can help manage total portfolio volatility, given its forecasted low correlations to stocks, bonds, and real estate. Since 2001, infrastructure securities have outperformed global equities during 15 of the 20 quarters where the Russell Global® Index experienced a negative quarterly return. On average, the S&P Global Infrastructure® Index has outperformed global equities by 2.9% per quarter during negative quarters.9 It’s this downside protection and the potential to avoid the impact of negative compounding (remember, a $1,000 investment which loses 50% of its value has to return 100% to attain its original value) that is likely capturing the attention of investors.
Outperformance of S&P Global Infrastructure® Index vs. MSCI World Index during quarters of negative equity market performance
4. Uncertainty reigns
The Economic Policy Uncertainty Index, which measures policy-related uncertainty around the world, is close to an all-time record, having recently notched its second-highest reading ever this past June.10 Uncertainty created by the ongoing China-U.S. trade war, as well as deteriorating economic conditions and a host of unpredictable geopolitical events, is negatively impacting both consumer and business sentiment. Given that infrastructure assets provide essential services, are defensive in nature and have resilient cash flows, it stands to reason that they’re poised to do better than more cyclical investments in these uncertain times. Indeed, the listed infrastructure asset class is forecast to log an earnings growth rate of 6% in the first year and 7% in the second year. In addition, it’s expected that dividends will grow faster than earnings, with dividend-per-share growth forecast at 8% per year over the next two years.11
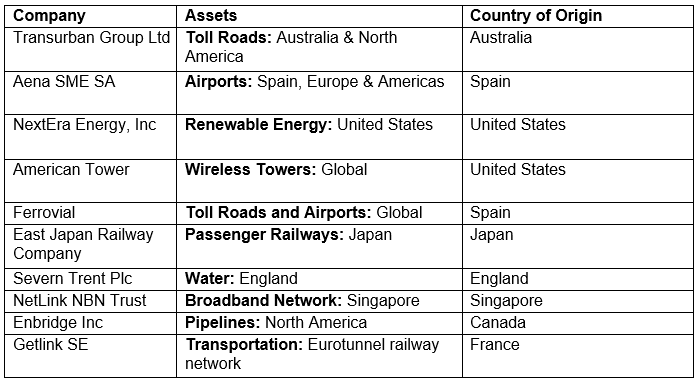
5. Access
A key feature of listed infrastructure is its ease of implementation. When compared to investing in infrastructure via private markets, potential benefits to investors include:
- Appropriate levels of geographic, sector and asset level diversification.
- Liquidity. This enables the active management of an infrastructure portfolio to:
1. Potentially generate excess returns through stock and sector selection.
2. Provide ongoing risk management. - Lower fees.
Furthermore, many of the world’s leading infrastructure companies and assets are accessible only through public markets. For example, consider the chart below12:
6. Private-market demand for listed infrastructure
Private-market demand for listed infrastructure assets is strong, given the valuation arbitrage in favor of public markets and the dry powder available across private infrastructure funds. It’s worth noting that dry powder held across private infrastructure funds has now grown to $200 billion. Leveraged, that provides approximately $500 billion of buying power. Some of that capital has and will continue to, work its way into public markets.13 For instance, in the second quarter of 2019, several public companies (Genesee & Wyoming, Buckeye Partners, and El Paso Electric) were the subject of takeover bids by private infrastructure investors at between 17% to 40% premium, relative to their share price.14
Bottom line
An aging infrastructure network rife with the need for upgrades, coupled with ease of access and the potential for steady returns, makes the listed infrastructure asset class a valid choice of consideration in these times of uncertainty. As the bull market grows longer in the tooth and the global economy continues to cool, we believe there’s no time like the present to consider exposure to listed infrastructure in a multi-asset portfolio.
1 Source: S&P Global Infrastructure Index
2 Source: McKinsey Global Institute, October 2017 “Bridging global infrastructure gaps”.
3 Source: Forbes, International Air Transport Association, “Air Travel Projected to Double in 20 Years, But Protectionism Poses Threat, October 2018
4 Source: CTIA 2019 Annual Wireless Industry Survey, June 2019
5 Source Bloomberg NEF, New Energy Outlook 2019, June 2019
6 Source: Russell Investments, S&P Dow Jones Indices, June 30, 2019
7 Source: Russell Investments, S&P Dow Jones Indices, June 30, 2019
8 Source: Russell Investments, S&P Dow Jones Indices, U.S. Treasury, June 30, 2019
9 Source: Russell Investments; as of 06/30/2019. Russell Investments calculations. Indexes are unmanaged and cannot be invested in directly. Past performance is not indicative of future results. Returns in USD. 10 Source: cnbc.com, “For economists and investors, the globe hasn’t been this confusing in at least three decades” August 2019
11 Source: Colonial First State Global Asset Management, “Global Listed Infrastructure Review and Outlook”, January 2019
12 Source: Russell Investments, August 2019
13 Source: Cohen & Steers Inc, Q2 2019 Earnings Call Transcript
14 Source: Colonial First State Global Asset Management, July 2019
Disclosure: Opinions expressed by readers don’t necessarily represent Russell’s views. Links to external web sites may contain information ...
more

