
What The Historical Data Says About Stock Market Losses
As I recently discussed, from an emotional perspective, steep market declines are difficult to deal with. The reason is we tend to feel the pain of a loss twice as much as we feel the joy from an equal-sized gain (the ratio increases with the size of the investment).
Research also has found that losses even lead to physical responses, such as pupil dilation and increased heart rate. This has been found to be true even for people who weren’t naturally averse to losses.
With the S&P 500 Index losing 13.5% in the fourth quarter of 2018, the risk of catastrophizing—not only focusing solely on the negative news, but assuming the worst will occur—increased.
Reviewing the historical data, however, just might help to keep you from catastrophizing your own financial situation. For instance, the following table shows each quarter the S&P 500 Index turned in a performance equal to or worse than the fourth quarter of 2018. Data is from Bloomberg.
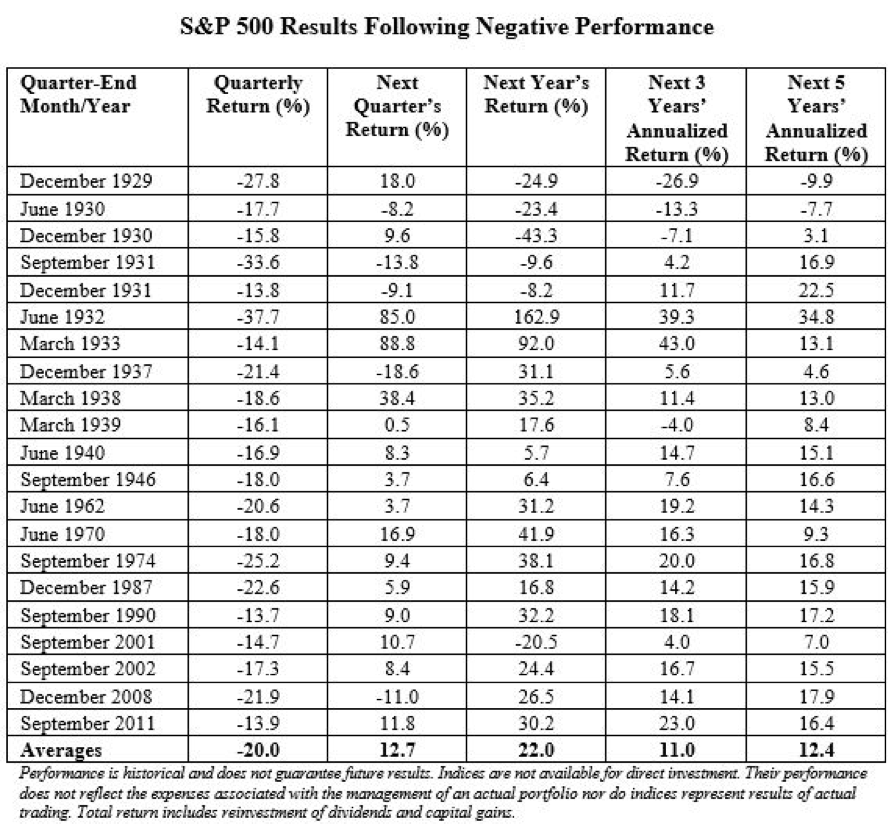
Statistical precedent
There were five cases when the next quarter’s return was negative, three of which saw losses in excess of 10%; but there were 16 cases when the following quarter’s returns were positive, seven of which were in double digits. The average return in following quarters was 12.7%. In addition, the average following 12-month returns, at 22%, were more than twice the historical return of about 10%.
Here are some other facts that might keep you from catastrophizing. The last two big bear markets began in March 2000 and October 2007. The following table, using data from J.P. Morgan Asset Management’s first quarter 2019 “Guide to the Markets,” compares valuations for the S&P 500 Index and the yield on the 10-year Treasury at those times to the corresponding figures at year-end 2018.

As you can see, valuations are now much lower than they were prior to the last bear markets. In addition, according to the J.P. Morgan Asset Management report, the 25-year average for the price-to-book (P/B) ratio for the S&P 500 has been 2.9. It’s now 2.7.
Of course, this doesn’t rule out a bear market occurring. Valuations could go a lot lower, as they did in 2008. That’s why your allocation to risky equities should never exceed your ability, willingness or need to take risk.
It’s also why your plan should include the virtual certainty that you will have to live through many bear markets. In fact, data from the report shows we have averaged a bear market, defined as a market drop of 20% or more, about once every six years, and a drop of at least 10% about once every three years.
Risk a given
Stocks are always risky. And investors should not be overconfident when designing their investment plans. There are simply no guarantees that, even over the long term, stocks will recover from losses.
Just consider that, in 1990, the Nikkei Index was approaching 40,000, and today it’s barely above half that level. Don’t let home-country bias, and the fact that U.S. stocks have outperformed international stocks for the past 10 years, allow you to believe that cannot happen here. It’s why global diversification is the prudent strategy. If your allocation varies a lot from how the global markets allocate capital, it’s like saying you are smarter than the collective wisdom of the market.
While the U.S. represents about half the global market capitalization, U.S. investors (like investors all over the globe) exhibit home-country bias (i.e., they believe their country is not only safer, but has higher expected returns), allocating only about 10% to international equities.
To help you avoid catastrophizing about international stocks, let’s look at valuations. While the current forward P/E for the S&P 500 is 14.4, the J.P. Morgan Asset Management report shows it’s just 11.5 for international stocks.
The best predictor we have of returns is valuations. Using Morningstar data, the current P/B ratio for U.S. stocks is about 3, twice that of the 1.5 P/B for international stocks (both developed and emerging markets). For value investors, Dimensional data shows the current P/B of its Emerging Markets Value Fund (DFEVX) is just 0.9, or less than one-third that of the S&P 500. It’s only slightly higher for the firm’s International Value Fund (DFIVX), at 0.95. And it’s even lower for its International Small Value Fund (DISVX), at 0.83.
Again, lower valuations, while predicting higher forward-looking returns, are not guarantees. If they were, there would be no risk.
Disclosure: My firm, Buckingham Strategic Wealth, recommends Dimensional funds in constructing client portfolios.


