
What S&P 500 Sectors Are Trading Below Economic Book Value
This report analyzes[1] market cap, economic book value, and price-to-economic book value (PEBV) ratio for the S&P 500 and each of its sectors.
S&P 500 PEBV Ratio Jumps to Highest Level Since September 2018
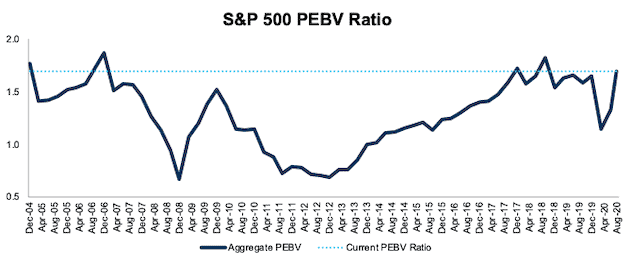
The PEBV ratio for the S&P 500 rose from 1.1 at the end of 2019 to 1.7 through 2Q20, or its highest level since mid-2018, and one of the highest levels since 2004. See Figure 1. This ratio measures the level of expectations for future profits compared to existing profit. At 1.7, the S&P 500’s valuation implies the profits of the S&P 500 will increase 70% from current levels.
Only one S&P 500 sector trades below its economic book value (excluding Energy, which has a negative economic book value), as we’ll show below.
Figure 1: TTM PEBV Ratio for the S&P 500 From December 2004 – 8/11/20
Sources for all images: New Constructs, LLC and company filings.
Ranking the S&P 500 Sectors by PEBV Ratio
Figure 2 ranks all 11 S&P 500 sectors by change in PEBV ratio from the end of 2019 to 8/11/20.
Figure 2: TTM PEBV Ratio as of 8/11/20 by Sector
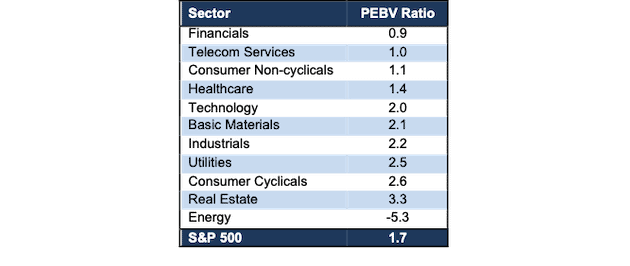
With a PEBV of 0.9, investors expect the Financials sector’s profits to decline, permanently, by 10% from current levels. On the flip side, investors expect the Real Estate sector to improve profits more than any other S&P 500 sector.
Details on Each of the S&P 500 Sectors
Figures 3-13 show the PEBV ratio trends for every sector since 2004.
We present the components of PEBV ratio, market cap and economic book value, for the S&P 500 and each S&P 500 sector in Appendix I.
Appendix II provides additional aggregated PEBV ratio analyses that adjust for company size/market cap.
Basic Materials: PEBV Ratio = 2.1
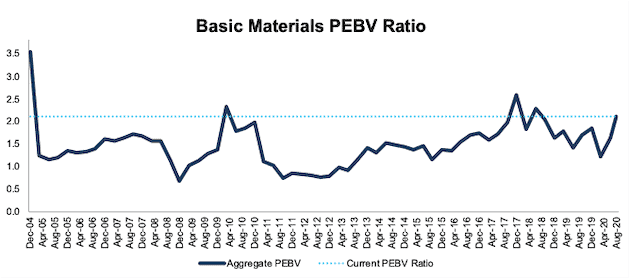
Figure 3 shows the PEBV ratio for the Basic Materials sector has consistently fallen since 2017 even after the market bounce back since March 2020. The Basic Materials sector PEBV ratio is the highest since June 2018 and has rarely been higher since 2004. Since the end of 2019, the sector market cap increased from $693 billion to $701 billion TTM while its economic book value fell from $377 billion to $334 billion over the same time.
Figure 3: Basic Materials PEBV Ratio: December 2004 – 8/11/20
Consumer Cyclicals: PEBV Ratio = 2.6
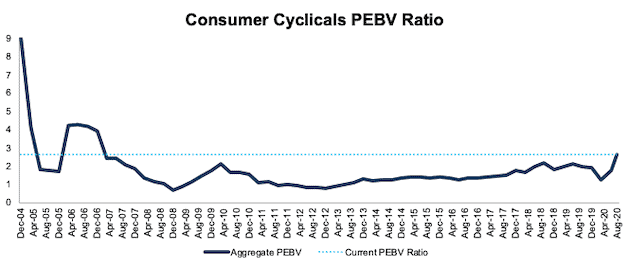
Figure 4 shows the PEBV ratio for the Consumer Cyclicals sector sits at the highest level since December 2006, which suggests investors expect sector profits to normalize after the COVID-19-induced economic downturn. The sector market cap has increased from 3.7 trillion at the end of 2019 to $4.3 trillion TTM while its economic book value fell from $2.0 trillion to $1.6 trillion over the same time.
Figure 4: Consumer Cyclicals PEBV Ratio: December 2004 – 8/11/20
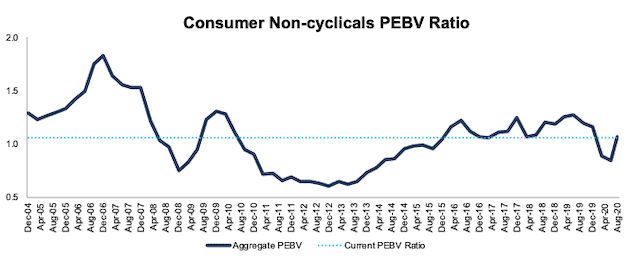
Consumer Non-cyclicals: PEBV Ratio = 1.1
Figure 5 shows the PEBV ratio for the Consumer Non-cyclicals sector is still below recent highs from 2016-2019. The sector market cap is largely stagnant, at $2.2 trillion from the end of 2019 to the TTM. Economic book value increased from $1.9 trillion to $2.1 trillion over the same time, which suggests investors see this sector as somewhat of a safe-haven during uncertain economic times.
Figure 5: Consumer Non-cyclicals PEBV Ratio: December 2004 – 8/11/20
.
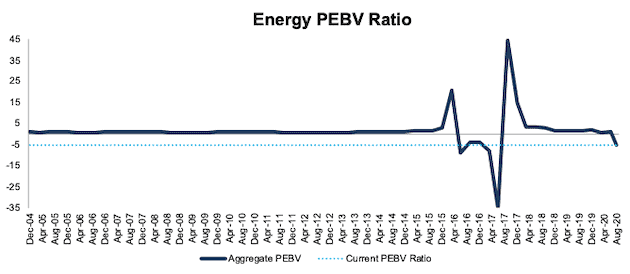
Energy: PEBV Ratio = -5.3
Figure 6 shows the COVID-19 impact on the Energy sector’s valuation which results in a negative PEBV for the first time since mid-2017. The Energy sector market cap fell from $1.2 trillion at the end of 2019 to $742 billion TTM while economic book value fell from $642 billion to -$139 billion over the same time. The large change in 2017 is driven by a large improvement in economic book value as oil prices, and therefore Energy firms’ profits, recovered from the precipitous fall in 2014-2016.
Figure 6: Energy PEBV Ratio: December 2004 – 8/11/20
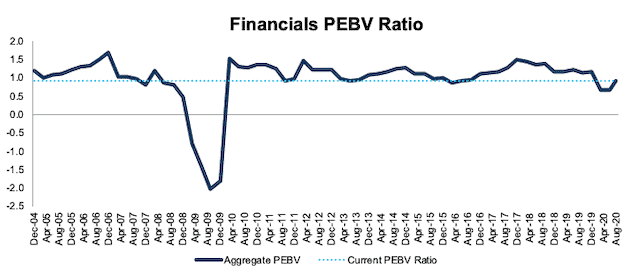
Financials: PEBV Ratio = 0.9
Figure 7 shows PEBV ratio for the Financials sector has been stable except for the Financial Crisis and has mostly been higher than it is now. The Financials sector market cap fell from $3.8 trillion at the end of 2019 to $3.1 trillion TTM while its economic book value increased from $3.2 trillion to $3.4 trillion over the same time.
Figure 7: Financials PEBV Ratio: December 2004 – 8/11/20
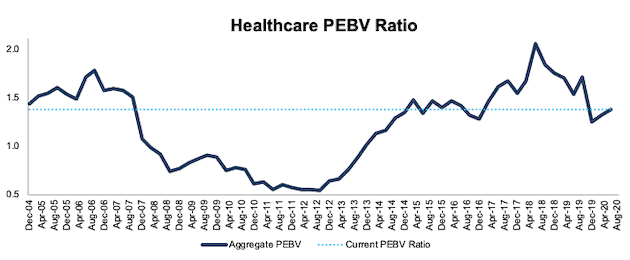
Healthcare: PEBV Ratio = 1.4
Figure 8 shows PEBV ratio for the Healthcare sector is near its lowest level since March 2017 (excluding March 2020). Figure 8 also shows how cheap the Healthcare sector was during and after the Financial Crisis, trading below its economic book value from mid-2008 until March 2014. The Healthcare sector market cap has increased from $3.7 trillion at the end of 2019 to $3.9 trillion TTM while economic book value improved from $2.2 trillion to $2.8 trillion over the same time.
Figure 8: Healthcare PEBV Ratio: December 2004 – 8/11/20
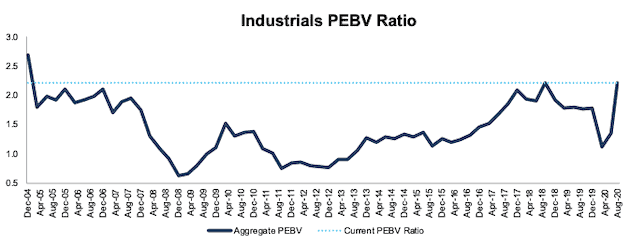
Industrials: PEBV Ratio = 2.2
Figure 9 shows the PEBV ratio for the Industrials sector has increased significantly since the end of 2019, has rarely traded higher since 2004, and shows that investors expect the sector’s profitability to rebound in a big way. The Industrials sector market cap fell from $2.9 trillion at the end of 2019 to $2.7 trillion TTM while economic book value declined from $1.6 trillion to $1.2 trillion over the same time.
Figure 9: Industrials PEBV Ratio: December 2004 – 8/11/20
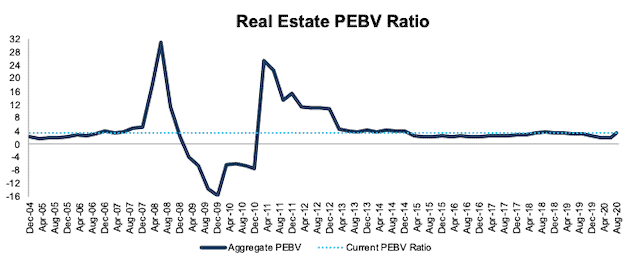
Real Estate: PEBV Ratio = 3.3
Figure 10 shows the PEBV ratio for the Real Estate sector is relatively stagnant save for the run up and crash around the Financial Crisis. The current sector PEBV is the highest since March 2019. The Real Estate sector market cap fell from $759 billion at the end of 2019 to $715 billion TTM and the economic book value fell from $309 billion to $216 billion over the same time.
Figure 10: Real Estate PEBV Ratio: December 2004 – 8/11/20
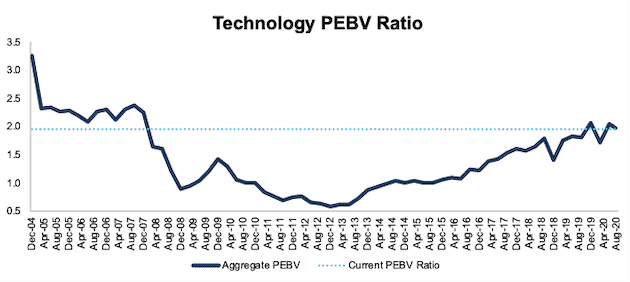
Technology: PEBV Ratio = 2.0
Figure 11 shows the current PEBV ratio for the Technology sector sits at levels last seen at the end of 2019, and prior to that, December 2007. The Technology sector market cap increased from $8.0 trillion at the end of 2019 to $9.6 trillion TTM and economic book value improved from $3.9 trillion to $4.9 trillion over the same time.
Figure 11: Technology PEBV Ratio: December 2004 – 8/11/20
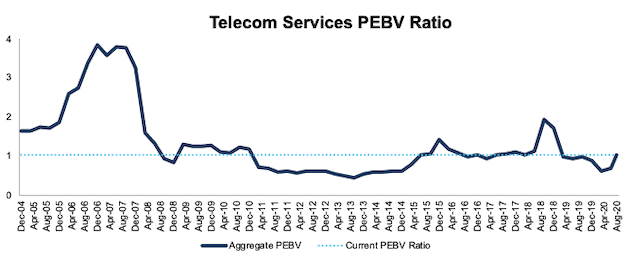
Telecom Services: PEBV Ratio = 1.0
Figure 12 shows the PEBV ratio for the Telecom Services sector has spiked in 2020, but the sector’s valuation remains equal to its economic book value. The sector market cap fell from $621 billion at the end of 2019 to $610 billion TTM while economic book value declined from $708 billion to $590 billion over the same time.
Figure 12: Telecom Services PEBV Ratio: December 2004 – 8/11/20
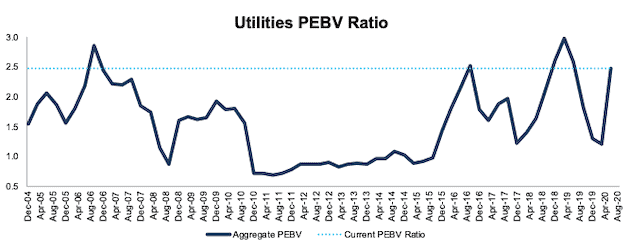
Utilities: PEBV Ratio = 2.5
Figure 13 shows the volatile nature of the PEBV ratio for the Utilities sector. The sector’s current PEBV ratio has only been surpassed in four periods, December 2006, March 2019, June 2019, and September 2019. The Utilities sector market cap fell from $888 billion at the end of 2019 to $837 billion TTM and economic book value fell from $489 billion to $338 billion over the same time.
Figure 13: Utilities PEBV Ratio: December 2004 – 8/11/20
[1] We calculate these metrics based on S&P Global’s (SPGI) methodology, which sums the individual S&P 500 constituent values for market cap and economic book value before using them to calculate the metrics. We call this the “Aggregate” methodology. Get more details in Appendix I and II.


