
What Is The Ichimoku Cloud Indicator
There are two key types of analysis used when trading or investing – the first is fundamental analysis (e.g. studying a company’s revenue and expenses) and the second is technical analysis (e.g. studying patterns in supply and demand).
Both are useful for timing entry and exit points, as well as determining which options will best suit which strategies.
This article will focus on technical analysis, specifically in the use of a special technical indicator called the Ichimoku Cloud indicator.
We’ll introduce you to just what is the Ichimoku Cloud indicator, how it is calculated, how it works, and how you can use it in your trading.
The Ichimoku Cloud Indicator
The Ichimoku Cloud indicator, also known as the Ichimoku Kinko Hyo (which translates to “one look equilibrium chart”), was created by a Japanese journalist named Goichi Hosada who published it in 1969.
Goichi wanted a way to quickly and easily identify support and resistance levels, trend directions and momentum levels to use as a way of generating trading signals.
Unlike standard candlestick charts which tend to focus on a few elements, the Ichimoku Cloud indicator contains a rich set of technical indicators that when plotted on a chart, create a ‘cloud’ shape.
It is this ‘cloud’ that provides traders with the ability to rapidly identify the trend direction and whether there are any potential trading signals within that trend.
When first observed, the Ichimoku Cloud can seem very complicated as there are a lot of data points being visualized.
Once traders look past the initial apparent complexity, they’ll find an indicator that is easy to understand and provides them with a number of well-defined trading signals.
How The Ichimoku Cloud Is Calculated
The Ichimoku Cloud consists of five plots, four of which are based on the average of the high and low over a set period of time.
While nowadays many traders would simply use moving averages, in the late 1960s personal computers were still not widely available so calculating the average of the highs and lows would have been much harder.
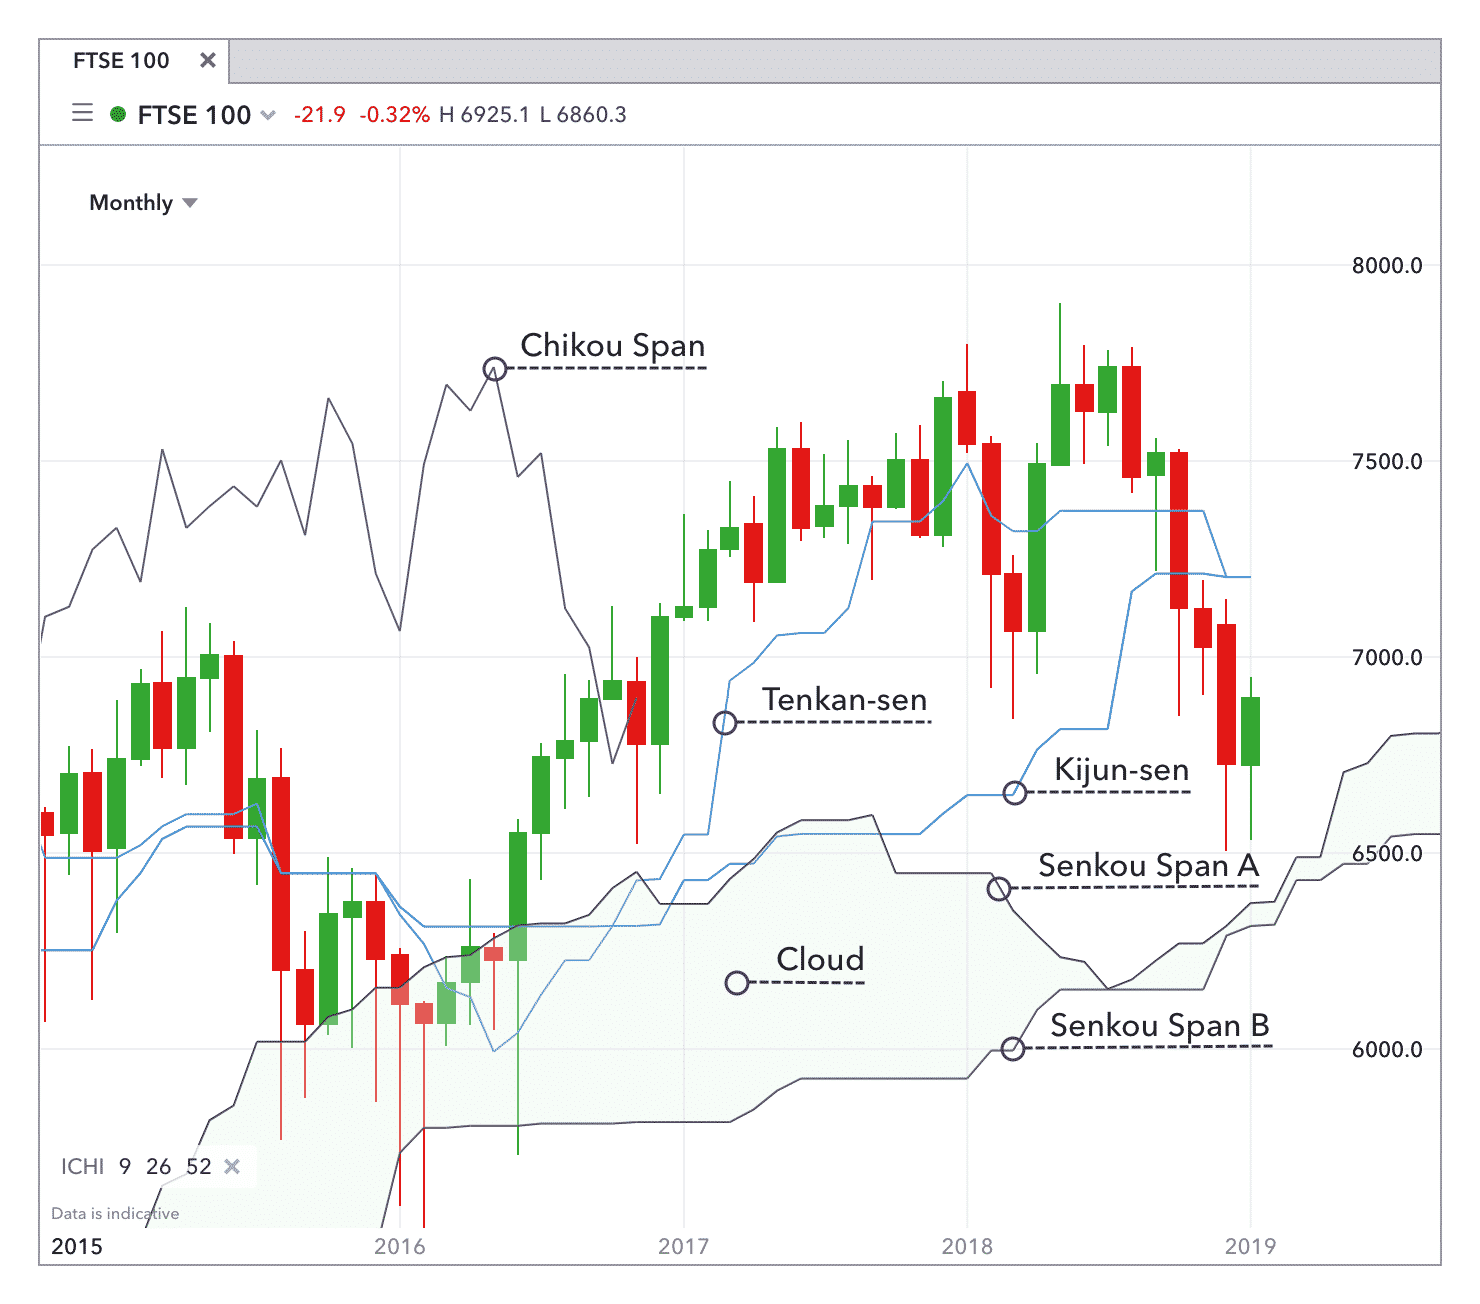
Source: IG.com
The five plots and their formulas are as follow:
Tenkan-Sen
Known as the ‘Conversion Line’, it is equal to the average highs and lows over the past 9 periods:
Conversion Line = (9 period high + 9 period low) / 2
Kijun-Sen
Known as the ‘Base Line’, it is similar to the Conversion Line but looks back over the past 26 periods:
Base Line = (26 period high + 26 period low) / 2
Senkou Span A
Known as the ‘Leading Span A’, it takes the average of the Conversion Line and Base Line:
Leading Span A = (Conversion Line + Base Line) / 2
The result helps to create one of the two cloud boundaries and is a ‘leading’ indicator as it is plotted 26 periods into the future.
Senkou Span B
Known as the ‘Leading Span B’, it takes the average highs and lows over the past 52 periods:
Leading Span B = (52 period high + 52 period low) / 2
Like Leading Span A, it is a ‘leading’ indicator as it is plotted 26 periods into the future and also informs one of the cloud boundaries.
Chikou Span
Known as the ‘Lagging Span’, it plots the closing prices over the past 26 days.
Lagging Span = 26 period close
How The Ichimoku Cloud Works
The Ichimoku Cloud uses two ‘clouds’ which are shaded regions, to signify trend direction and support and resistance levels.
To create the first of the two clouds, when Leading Span A is above Leading Span B, the region between these two lines is colored green.
The second cloud is created when Leading Span A is below Leading Span B – the region between these two lines is colored red.
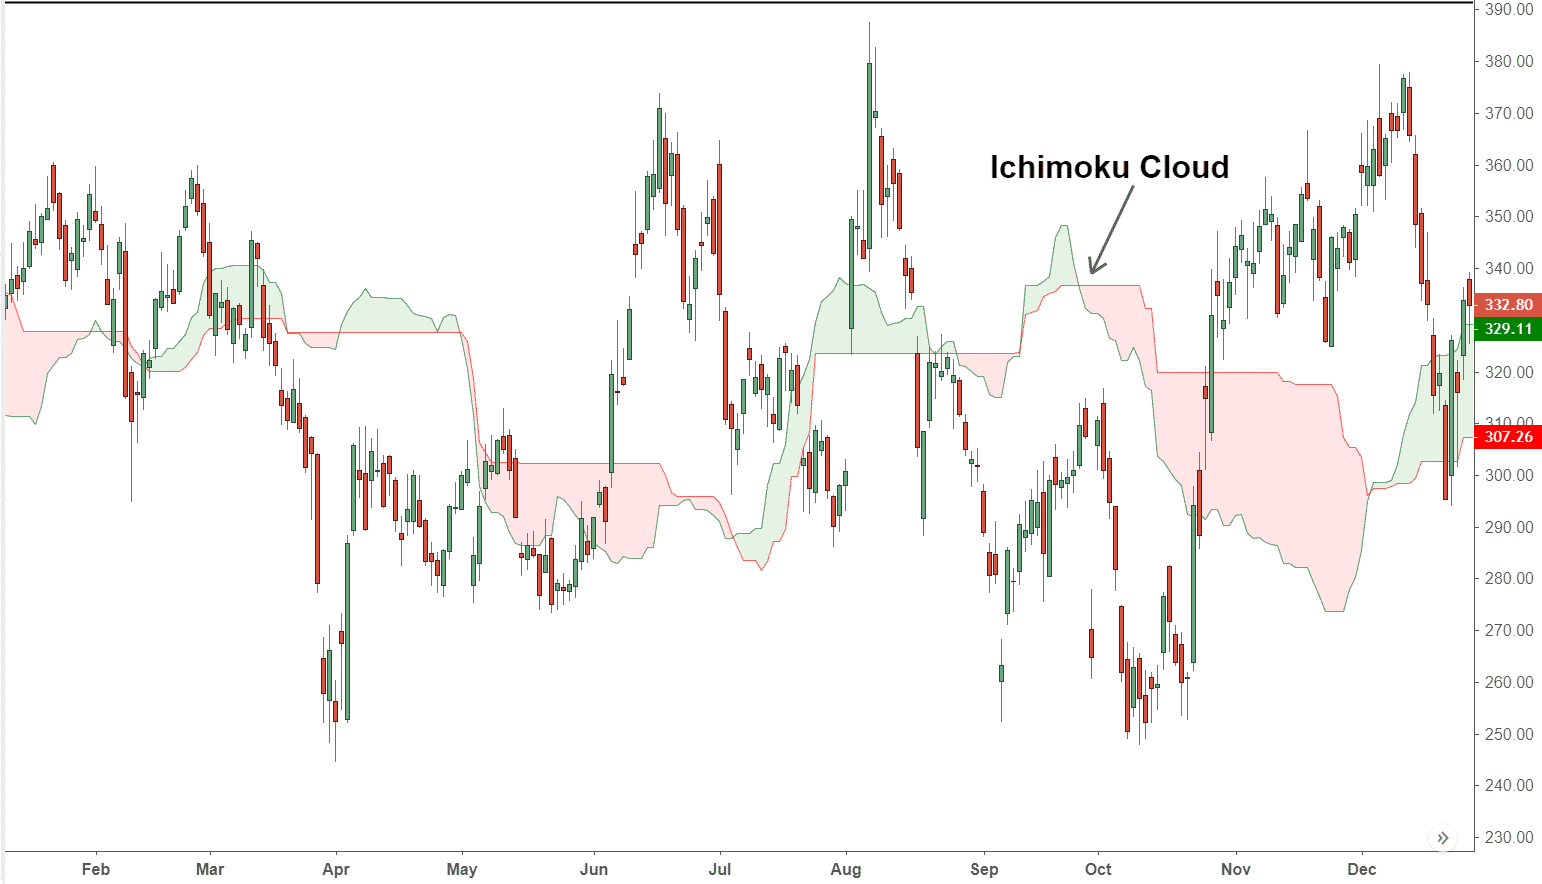
Source: Investopedia.com
One of the key uses of the Ichimoku Cloud is to signal the direction of a trend.
Understanding trend directions using the Ichimoku Cloud is very easy and revolves around where the price is situated in relation to the clouds.
When the price is found to be above a cloud, this signifies that the overall trend is up.
Similarly, when the price is below a cloud, this signifies that the overall trend is down.
Finally, when the price is found inside the cloud, it signifies there is no trend or that there is a transition occurring between trends.
Apart from signifying the direction of the trend, the clouds also signify potential areas of support and resistance (depending on whether the price starts above or below these clouds).
The Ichimoku Clouds hold an advantage over traditional support and resistance indicators because the clouds show future potential resistance points rather than current ones that traditional indicators do.
Finally, momentum is indicated based on whether the price and Conversion Line moves above or below the Base Line.
How To Use the Ichimoku Cloud In Your Trading
The Ichimoku Cloud is typically used as a rich source of trading signals, both bullish and bearish.
Apart from using the clouds to gauge future support and resistance levels, traders will also keep an eye out for these bullish and bearish signals:
Bullish Signals
- The price moves above a cloud, signifying that the trend direction is up.
- The cloud changes color from red to green, signifying a positive change within the trend.
- The price rises above the Base Line, signifying improving momentum.
- The Conversion Line rises above the Base Line, also signifying improving momentum.
Bearish Signals
- The price falls below a cloud, signifying that the trend direction is down.
- The cloud changes color from green to red, signifying a negative change within the trend.
- The price falls below the Base Line, signifying changing momentum.
- The Conversion Line falls below the Base Line, also signifying changing momentum.
The Ichimoku Cloud is also used in conjunction with other technical indicators in order to improve the chances of being correct.
A common indicator that is paired with the Ichimoku Cloud is the Relative Strength Index (RSI), which serves to confirm that momentum identified in the Ichimoku Cloud is in fact, correct and not a false signal.
Since the Ichimoku Cloud is a fairly fast trend-follower (it identifies trends over a very short period), it is also paired with longer-term trend indicators like a 200-day moving average.
The reason being is that the strength of a long-term trend can overwhelm a short-term trend and cause a reversal (such as the price moving above a cloud during a very strong long-term downtrend).
The final key way to use the Ichimoku Cloud is to wait until a crossover occurs between the Conversion Line and the Base Line.
When the Conversion Line rises above the Base Line at a time when the price is above the cloud, this represents a very strong bullish signal.
When using the Ichimoku Cloud it’s worth exploring whether your charting package can remove some of the lines – since there’s so much data being charted, not all of it might be relevant at that point in time.
For example, you might want to focus only on clouds (charting Leading Span A and Leading Span B) to keep an eye on support and resistance.
The other consideration to keep in mind is that if the price remains well above or below the clouds, they could become irrelevant for a long period of time.
In these cases switch your focus to the Conversion Line and Base Line which tracks prices more closely and monitor for any crossover events.
Conclusion
Published in 1969 by Goichi Hosada, the Ichimoku Cloud indicator is used to provide trading signals and information on support and resistance levels, trend direction and momentum.
It is created by plotting five points, the majority of which are based on the highs and lows over a set period of time.
These plots create two key lines that track prices closely as well as two ‘clouds’ colored green and red.
The clouds and key lines are used to indicate several bullish and bearish signals.
Bullish signals include a positive trend direction when the price moves above the cloud or when a red cloud changes to a green cloud.
Bullish momentum is identified when either the price or the Conversion Line rises above the Base Line.
As for bearish signals, they include a negative trend direction when the price moves below the cloud or when a green cloud changes to a red cloud.
Bearish momentum is signaled when either the price or the Conversion Line falls below the Base Line.
The Ichimoku Cloud indicator is best used in conjunction with other indicators such as RSI (for momentum) or 200-day moving averages (for long-term trends) to confirm signals.
Disclaimer: The information above is for educational purposes only and should not be treated as investment advice. The strategy presented would not be suitable for investors who are ...
more

