
What Do Central Bankers Know?
In last week's missive we discussed a critical point concerning the bull run so far.
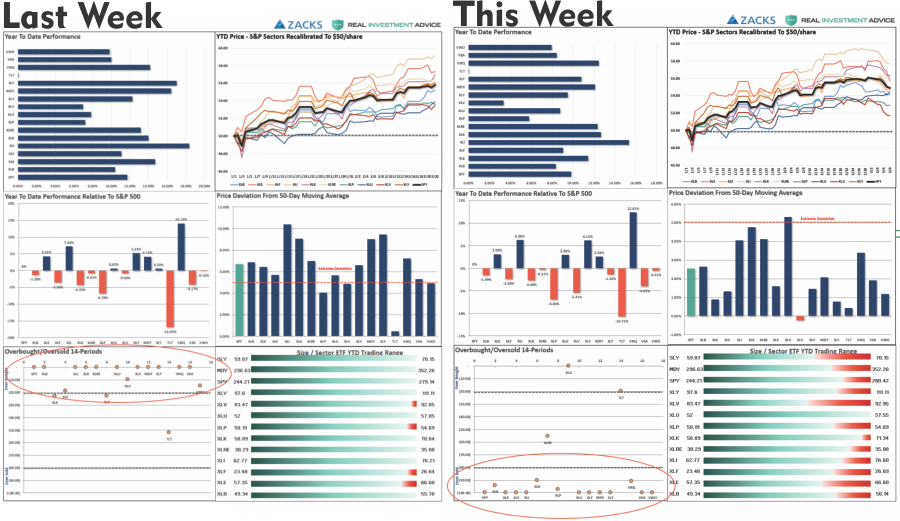
“Despite the underlying economic and fundamental data, the markets have surged back to extremely overbought, extended, and deviated levels. The chart table below is published weekly for our RIA PRO subscribers (use code PRO30 for a 30-day free trial)
You will note that with the exception of bond prices, every market and sector is more than 5% above its 50-day moving average and year-to-date performance is pushing more historic extremes both in price and in extreme overbought conditions.
On virtually every measure, markets are suggesting the fuel for an additional leg higher in assets prices is extremely limited.”
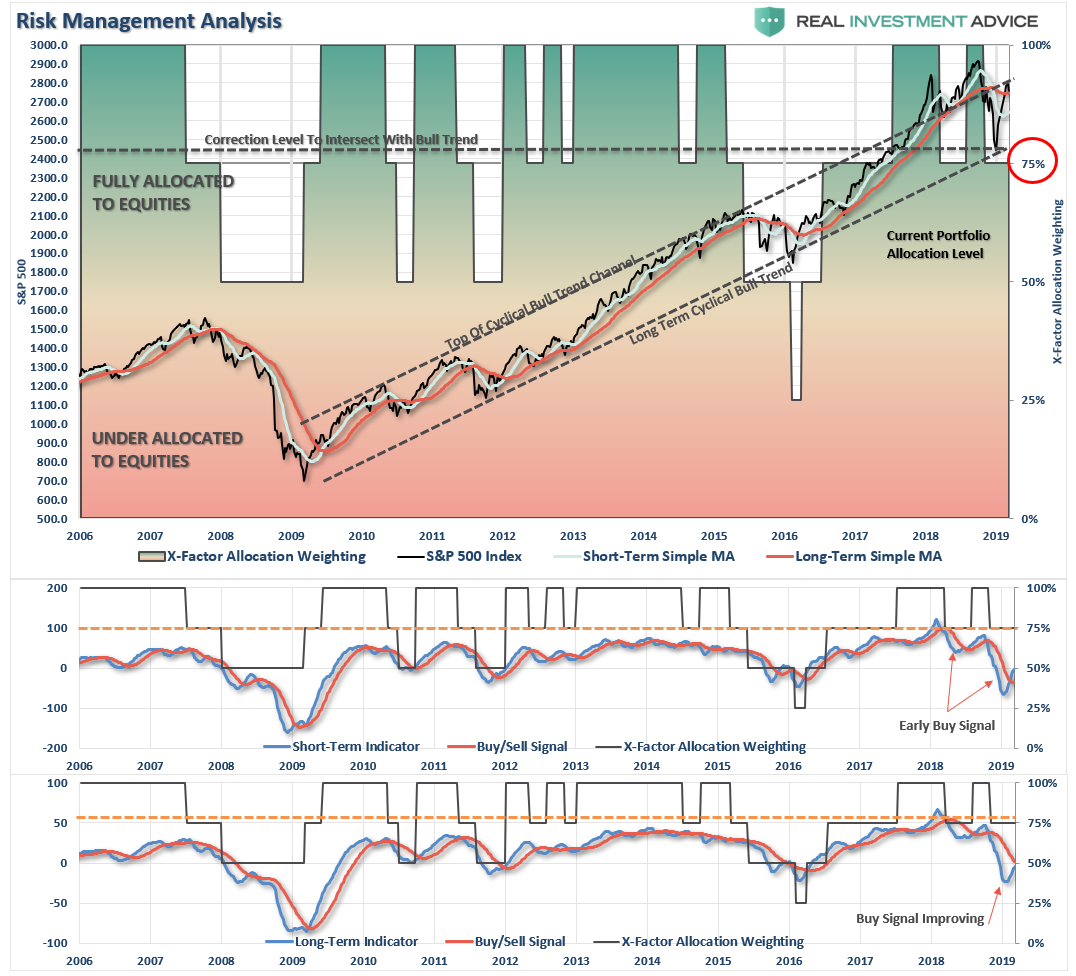
The chart below compares last weeks analysis to this week. You can see the sharp difference between the two periods as much of the overextension last week has now been reversed.
The chart below also shows the short-term reversal of the market as well as the test of minor support at the initial October lows.
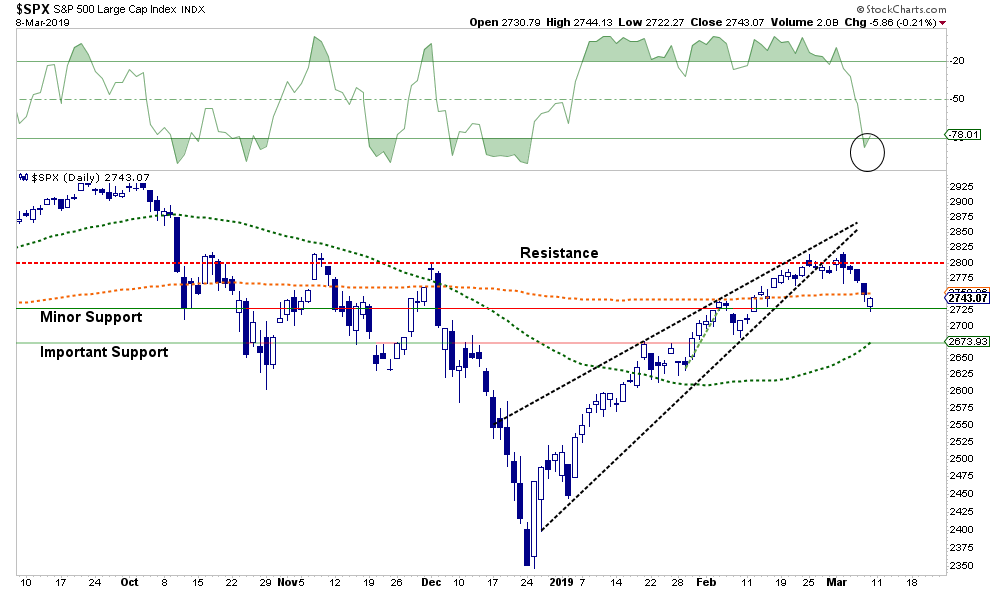
This short-term oversold condition, and holding of minor support, does set the market up for a bounce next week which could get the market back above the 200-dma. The challenge, at least in the short-term remains the resistance level building at 2800.
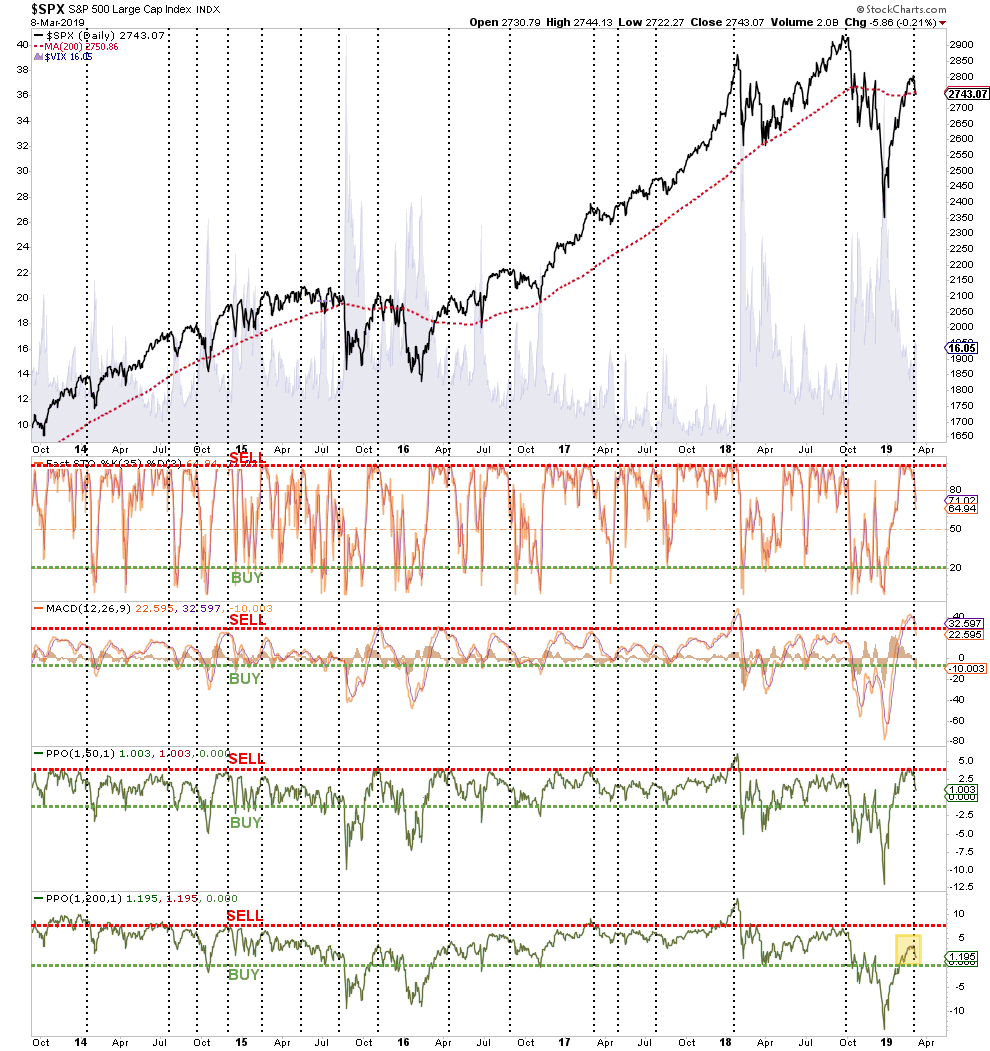
However, the next two charts suggest there is a decent probability any bounce will fail in the short-term and should be used for rebalancing risk.
- The market has not reversed to levels which normally signals short-term bottoms. The red lines in the bottom four panels denote periods where taking profits, and reducing risk, has been ideal. The green lines have been prime opportunities to increase exposure. As you will note, these indicators tend to swing from extremes and once a correction process has started it is usually not completed until the lower bound is reached.
Important Note: This does not mean the market will decline sharply in price. The current overbought conditions can also be resolved by continued consolidation within a range as we have seen over the last two weeks.
2) There is historically a very high correlation between what happens in the transportation sector (a view on the economy) and the market as a whole. Watch for a rally in the transportation sector to signal an all-clear for the markets.
![]()
The current set-up suggests that the correction that started last week is not yet complete and any bounce will likely be a good opportunity to re-position portfolios in the short-term until a better entry point to increase exposure is achieved.
The problem with statements like these is that those of the “permanently bullish” mindset tend to extrapolate the analysis into the onset of the next major “bear market.” Such is certainly not the intent, nor is it a suggestion to sell everything and hide in cash.
What should be readily apparent is that paying attention to price can help alleviate our natural tendency to “buy high” and “sell low.” Managing a portfolio of investments is simply measuring risk and reward and placing bets when reward outweighs the potential risk. Tweaking exposure to“risk” over time can pay big dividends over the long-term which is our goal of investing to begin with.
This is why every great investor throughout history has basic investing rules which all revolve around limiting losses to capital. Here are James Montier’s 7-Immutable Laws Of Investing:
- Always insist on a margin of safety
- This time is never different
- Be patient and wait for the fat pitch
- Be contrarian
- Risk is the permanent loss of capital, never a number
- Be leery of leverage
- Never invest in something you don’t understand
If these rules sound logical to you, and you are nodding your head in agreement, then how does a pitch to “buy and hold” and “ride out the market” make any sense?
During a bull market cycle, buying and holding good investments which pay a dividend is absolutely the right thing to do. However, at the end of market cycle, not so much.
What Do Central Banks Know That You Don’t
As we noted in Thursday’s missive on why QE may not work this time,Central Bankers globally have jumped back into the “emergency measure”pool.
- The Fed
- Has announced it will be “patient” with future rate hikes.
- The pace of QT, or balance sheet reduction, will not be on “autopilot”but instead driven by the current economic situation and tone of the financial markets.
- It is expected the Fed will announce in March that QT will end and the balance sheet will stabilize at a much higher level, and;
- QE is a tool that WILL BE employed when rate reductions are not enough to stimulate growth and calm jittery financial markets.
- China has launched its version of “Quantitative Easing” to help prop up its economy which grew at the slowest pace in nearly 30-years.
- China has taken fiscal and monetary policy measures such as fast-tracking infrastructure projects
- Additional monetary support for the economy
- A cut in taxes, and;
- A Reductionbanks’ reserve requirements
-
The ECB, after downgrading Eurozone growth, announced
-
They will not raise rates in 2019, and;
-
They will extended the TLTRO program, which is the Targeted Longer-Term Refinancing Operations scheme which gives cheap loans to struggling Eurozone banks, into 2021. (Currently, Italy, Spain, Greece, and Portugal all borrow more than they deposit and more tha $800 billion from the previous TLTRO is set to mature over the next two years. Without the extension of the program, defaults could rise sharply.)
-
But there is nothing to worry about, right?
Maybe, but if there is nothing to worry about, then why the sudden pivot by Central Banks? What are they seeing that you don’t?
As we discussed in our analysis, the macro-environment in the U.S. is markedly different than it was in 2009. The Fed’s starting point to battle the next recessionary environment is far weaker than it was then when the Fed funds rate was twice as high and the balance sheet four-times smaller.
Here is the important point. We, as investors, have been trained over the last decade to “buy” whenever Central Banks are engaged in monetary interventions. So far it has worked in lifting asset prices higher. But therein lies the risk of complacency.
In 2009, most of the risk in the financial and credit markets had been wrung out from the decline. Today, the markets are more exposed than ever to leverage and credit risk throughout the global ecosystem.
My friend Doug Kass had a great note Friday related to this risk.
“Astonishingly I heard a ‘talking head’ on one of the business media platforms earlier this week who said that none of the excesses that existed in past recessionary periods are in place today.
To say excesses, systemic issues, and possible instability, don’t exist is borderline irresponsible.
As I see it, there are several measurable excesses and associated risks that represent this cycle’s new challenges that may be summarized into these five categories:
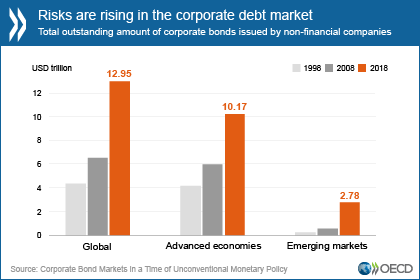
- An untenable level of global (private and public sector) debt
- Structural instability and growth threats in the form of rising deficits and demographic trends (i.e., slowing population growth)
- Lack of (sovereign) cooperation
- Unparalleled political instability and rising policy risks
- A dangerous shift in market structure
Debt
Debt that is not self-funding is future consumption brought forward.
Through years of unprecedented monetary ease, we have enjoyed unsustainable consumption and growth which cannot continue at its current pace in the future. Debt, then, is a drag on future growth, and the amount of debt the world now has will be a monster drag on that growth.
The fact is that the global economies are over levered with debt in our private and public sectors that are excessive. As I chronicled in “Why Interest Rates Are the Bull Market’s Most Serious Threat,” in the fullness of time, the weight of debt will act as a governor to economic growth – it saps capital. To think otherwise is foolhardy.
Deficits and Demographic Threats
Under the weight of rising and uncontrolled deficits (supported by both parties) and slowing population growth, intermediate to longer-term economic and profit growth prospects are diminishing. Near term, domestic economic growth is already weakening (as supply side economics is being further discredited). At the same time Chinese growth is failing to stabilize and it appears that Europe is entering a deepening recession – underscoring the fragility of the global economic system that is still being propped up by low or negative interest rates.
China
It is my core expectation that U.S. and China will fail to agree on trade. (My baseline expectation is that investors will view a likely, superficial agreement as no agreement at all). We will find out shortly whether my view is accurate and that there will be no big deliverables with regard to IP theft and/or technology exchange. The consequences for the global economy are obvious – China accounts for only about 14% of world GDP but accounts for about one third of the delta in global economic growth.
Earnings & Risk
Most importantly, for investors, the consensus expectations for corporate profits, and economic growth expectations, remain far too optimistic.”
I will steal his last line as I agree that risks currently remain to the downside which explains our cautious outlook for 2019-2020.
If the message that Central Banks are sending comes to fruition, it will likely be a challenging backdrop for equities in the months ahead.
Currently, it certainly seems these concerns are outlandish and far fetched but the data is all too present and real. After a scorching run in the first two months of the year, it is hard to see anything as being bearish, but therein lies the risk.
As an investor, our job should be an honest evaluation of our portfolio allocations and our investment strategy with relation to the relevant market risks.
In other words, ask yourself this one simple question:
“What will happen to my money if something goes wrong?”
If that question raises no concerns for you, do nothing? But if you didn’t like the plunge last November and December, it may be time to re-evaluate things.
THE REAL 401k PLAN MANAGER
A Conservative Strategy For Long-Term Investors
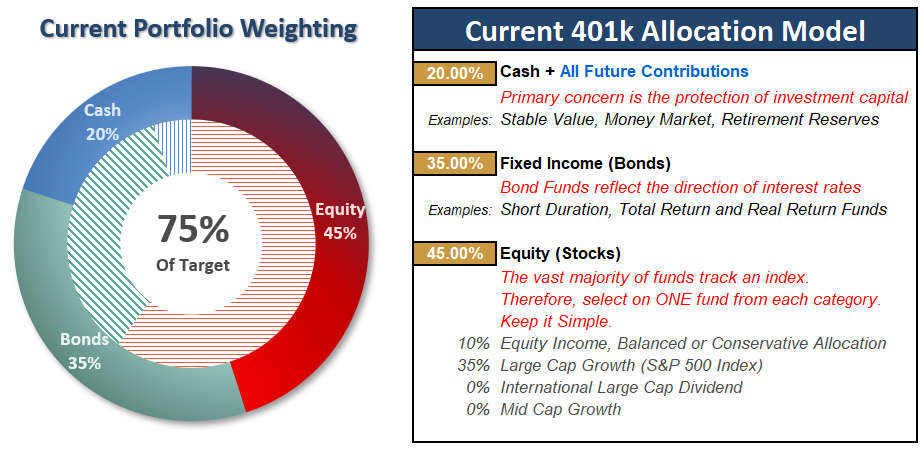
There are 4-steps to allocation changes based on 25% reduction increments. As noted in the chart above a 100% allocation level is equal to 60% stocks. I never advocate being 100% out of the market as it is far too difficult to reverse course when the market changes from a negative to a positive trend. Emotions keep us from taking the correct action.

Just The Chart, Ma’am
As I noted two weeks ago:
“As shown in the 401k chart above, the short-term weekly ‘buy’ signal was triggered last week. This is bullish but requires the lower signal to “confirm” the upper before we increase the portfolio model back to 100% target levels.
Importantly, by the time weekly signals are triggered the market is ALWAYS very overbought or oversold. Therefore, when signals are registered we don’t immediately take action. Instead, like now with markets are extremely overbought on a short-term basis, we want to wait for some type of pullback to add exposure.”
As we have been discussing over the last several weeks, the sharp rally in stocks has gone too far, too quickly, so just be patient here and wait for a correction/consolidation to increase exposure.
Take a look at the chart above. Beginning in 2016, I drew a bull trend channel for the market in the chart above (the dashed 45-degree black lines) which have contained the bull market rally since the 2009 lows.
In January 2018, the market made, as we stated then, an unsustainable break above that upper trend line. I add the horizontal black dashed line at that point and said that ultimately we would see a correction back the long-term bull trend line.
Since then, exactly that has happened and rather than the market retesting the lower bullish trend line and then beginning a more normal advance, the market rocketed higher in two months to hit AND FAIL at the upper bullish trend line.
If the last decade provides any clues, it is likely the market is going to remain range bound within this rising trend for now, which suggests that waiting for a better entry point to increase exposure will be rewarded.
As we noted last week:
“While it may seem like ‘a correction will never come,’ such is always the case in a bull rally. Bull rallies do their best to suck investors into taking on risk at the wrong time. Patience always provides a better opportunity over the longer-term time frames.”
Let’s be patient and see if the market can rally next week. Continue to follow the model strategy for the time being.
- If you are overweight equities – take some profits and reduce portfolio risk on the equity side of the allocation. This will provide an opportunity to use cash to add exposure post the pending correction/consolidation.
- If you are underweight equities or at target – hold positions for now and wait for a better opportunity to increase allocations. Don’t worry, you haven’t missed anything.
Current 401-k Allocation Model
The 401k plan allocation plan below follows the K.I.S.S. principle. By keeping the allocation extremely simplified it allows for better control of the allocation and a closer tracking to the benchmark objective over time. (If you want to make it more complicated you can, however, statistics show that simply adding more funds does not increase performance to any great degree.)
401k Choice Matching List
The list below shows sample 401k plan funds for each major category. In reality, the majority of funds all track their indices fairly closely. Therefore, if you don’t see your exact fund listed, look for a fund that is similar in nature.


