
What Can We Learn From The 'Next 20' Stocks In The S&P 500?
Many readers are probably familiar with the fact that the largest 5 stocks in the S&P 500 Index—Apple (AAPL), Microsoft (MSFT), Amazon (AMZN), Facebook (FB), and Alphabet (Google) (GOOGL & GOOG) —have had an outsized impact on the performance of the overall index.
Click to enlarge
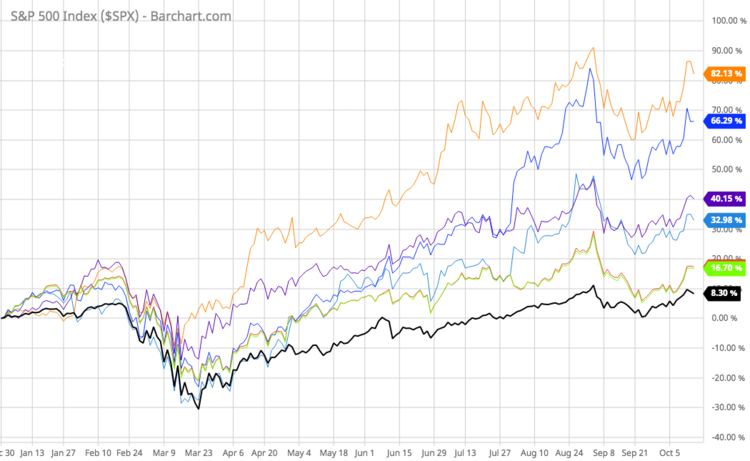
chart courtesy of barchart.com; AMZN = orange; AAPL = dark blue; MSFT = purple; FB = light blue; GOOG & GOOGL = green & red (they track together); S&P 500 Index (as a whole) = black
The question I had was, what about the next 20 stocks? What does this group look like? How are they valued? And so on. These 25 stocks account for roughly 1/3 of the entire index.
I skipped the 7th largest holding in the index, Berkshire Hathaway (BRK.B), since it is a diversified conglomerate, and started at #8. The following table shows the name, industry, diluted earnings per share (EPS) for the most recent completed fiscal year, current price (rounded), and the P/E ratio based on these most recently completed fiscal years for these next 20 stocks.
| Company | Sector | Diluted EPS | Current Price | P/E Ratio | |
|---|---|---|---|---|---|
| 1 | Johnson & Johnson (JNJ) | Health Care | $5.63 | $148 | 26.3 |
| 2 | Procter & Gamble Company (PG) | Consumer Staples | $4.96 | $144 | 29 |
| 3 | Visa Inc. Class A (V) | Technology | $5.32 | $202 | 38 |
| 4 | NVIDIA Corporation (NVDA) | Technology | $6.63 | $564 | 85 |
| 5 | JPMorgan Chase & Co. (JPM) | Financials | $10.72 | $100 | 9.3 |
| 6 | UnitedHealth Group Incorporated (UNH) | Health Care | $14.33 | $322 | 22.5 |
| 7 | Home Depot Inc. (HD) | Consumer Discretionary | $10.25 | $287 | 28 |
| 8 | Mastercard Incorporated Class A (MA) | Technology | $7.94 | $343 | 43.2 |
| 9 | Verizon Communications Inc. (VZ) | Communication Services | $4.65 | $58 | 12.5 |
| 10 | salesforce.com inc. (CRM) | Technology | $4.34* | $262 | 60.4 |
| 11 | Netflix Inc. (NFLX) | Communication Services | $4.13 | $541 | 131 |
| 12 | Adobe Inc. (ADBE) | Technology | $6.00 | $506 | 84.3 |
| 13 | Intel Corporation (INTC) | Technology | $4.71 | $54 | 11.5 |
| 14 | PayPal Holdings Inc (PYPL) | Technology | $2.07 | $204 | 98.6 |
| 15 | Walt Disney Company (DIS) | Communication Services | $6.64 | $127 | 19.1 |
| 16 | Comcast Corporation Class A (CMCSA) | Communication Services | $2.83 | $45 | 15.9 |
| 17 | Pfizer Inc. (PFE) | Health Care | $2.87 | $37 | 12.9 |
| 18 | Merck & Co. Inc. (MRK) | Health Care | $3.81 | $81 | 21.3 |
| 19 | AT&T Inc. (T) | Communication Services | $1.89 | $28 | 14.8 |
| 20 | Walmart Inc. (WMT) | Consumer Staples | $5.19 | $144 | 27.7 |
*I used free cash flow per share for salesforce.com as I found it to be more representative of the current business.
Sectors
The following chart shows the outsized representation of the Information Technology and Communication Services sectors in the Next 20.
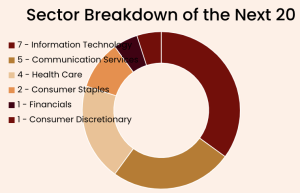
source: True Vine Investments
Notably, and this can be extended to the first 27 stocks in the S&P 500, there are 0 companies representing the Industrials, Materials, and Energy sectors.
Valuations
The P/E ratios of the Next 20 range from a low of 9.3 (JPMorgan) to a high of 131 (Netflix). The average for the group is 39.6. As a group, they are just as overvalued as the Top 5.
The earnings ratio—which is the earnings per share divided by the price per share—for the Next 20 is 2.5%. To be clear, let me explain further. The earnings yield is the hypothetical yield of the recent earnings of a stock based on the current price. Theoretically, this can be compared to bond yields to gauge the relative valuation of stocks and bonds. In recent decades, the average earnings yield of the S&P 500 has been similar to the average Baa or BBB corporate bond yield (the lowest category of investment grade bonds and one notch above “junk” bonds). At present, the earnings yield is still about 1% above the Baa/BBB corporate bond yield. The remaining gap between earnings yields and bond yields is one of only a few reasons to remain broadly, fundamentally bullish on stocks right now.
The Big Picture
I think it is worth asking, what would the extreme of a 12-year situation with the following fundamental attributes look like:
-
floundering economic growth
-
deflationary forces pushing down commodity prices and interest rates (to extreme lows)
-
weak commercial bank loan growth
-
Federal Reserve that can only buy bonds that induces (1) more corporate and government debt and (2) investors to move out the risk spectrum
-
bubble in technology stocks and anything that is perceived as a “safer” growth stock
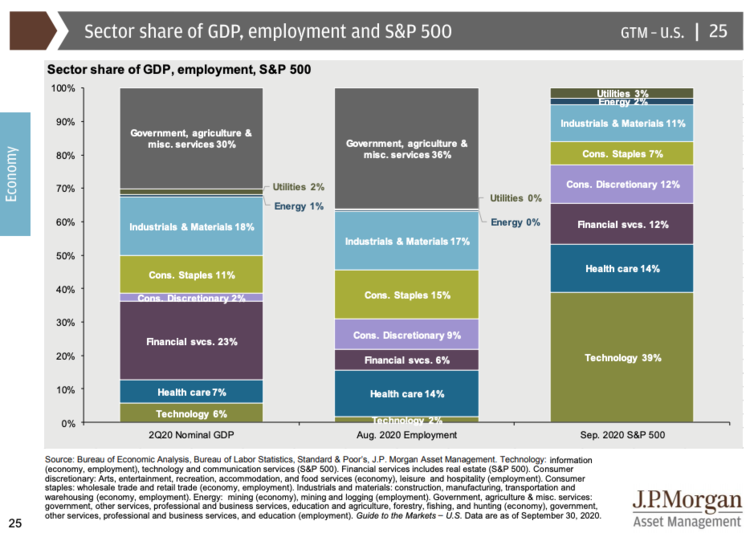
More relevant to this Letter, what would this look like in the stock market at such an extreme, after 12 years of escalating momentum compounding these secular trends? Before answering this, consider the following slide from JPMorgan Asset Management:
View fullsize
Note the following:
-
Technology sector represents 39% of the S&P 500 but only 6% of U.S. Gross Domestic Product (GDP) (technology bubble)
-
Financial sector represents only 12% of the S&P 500 but 23% of U.S. GDP (extreme low in interest rates, dismal bank lending)
-
Industrials & Materials sectors combined only represent 11% of the S&P 500 but account for 18% of GDP (weak economic growth, lack of capital investment, low commodity prices)
So what would this look like in the stock market at its extreme?
It would look like the Next 20.
The True Vine Letter was originally published on October 16, 2020.
Disclaimer: The True Vine ...
more


The performance of "the star performers" has seldom represented the performance of the rest of the crowd. Thus it is very seldom an accurate indication of reality. Certainly the S&P has a use, but it is not to indicate the actual over-all condition.