
Well-Behaved Inflation – And Outlook – Key To Fed’s Ultra Accommodative Monetary Policy
June’s CPI was reported yesterday. Inflation behaves well. This makes the Fed’s job easier to continue to pour liquidity into the system. All hell breaks loose once inflation refuses to cooperate – whenever that is.
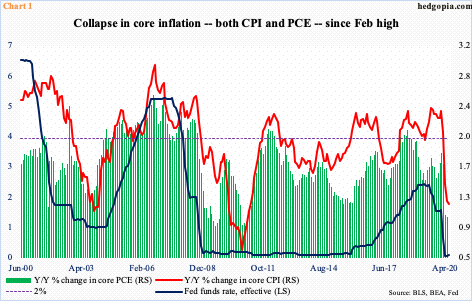
After three successive months of month-over-month drop, core CPI (consumer price index) edged up 0.2 percent in June. But the overall trend has been down particularly since February. In the 12 months to June, core CPI only rose 1.19 percent – the lowest since February 2011.
Core PCE (personal consumption expenditures) – the Fed’s favorite measure of consumer inflation – shows the same trend.In the 12 months to May, it increased 1.02 percent, which was the slowest pace since January 2011.(June’s data will be released on the 31st.). The central bank has a two percent objective.
The Fed has a dual mandate of maximum employment and price stability.In March and April, the US economy lost 22.2 million non-farm jobs, before gaining 7.5 million in May and June. The unemployment rate rose as high as 14.8 percent in April.It was down to 11.1 percent by June but remains uncomfortably high. This enables the Fed to aggressively adopt an accommodative monetary policy; the Fed funds rate is essentially at zero. The other piece in this is inflation, which also needs to cooperate, and it has.
Thus far, markets do not expect this to change anytime soon. The five-year, five-year forward inflation expectation rate in June was 1.53 percent.As subdued as this is, April’s was 1.45 percent, so the trend is up. A few more months of this, and markets will begin to take notice. A higher inflation outlook has the potential to mess up a lot of things, not the least of which is the Fed’s own balance sheet.
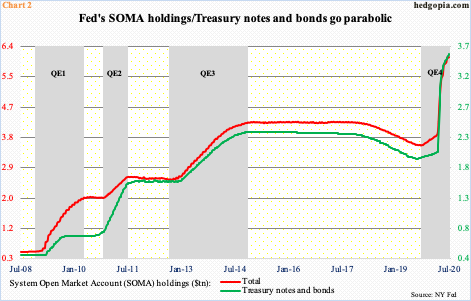
At the end of August last year, the Fed began to again grow its balance sheet as it sought to deal with money market stresses. At the time, it had $3.76 trillion in assets. Then the coronavirus hit. On March 23rd, it announced an open QE as well as said it would start buying investment-grade corporate bonds, which on April 9th was expanded to also include high-yield. The balance sheet went parabolic – from $4.16 trillion late February to $7.17 trillion in the week to June 10th. Since that high, the balance sheet has dropped by $248.2 billion to $6.92 trillion.
However, SOMA (System Open Market Account) holdings continue to rise – from $3.55 trillion late September last year to $3.82 trillion late February to $6.11 trillion last week (as of Wednesday).Of this, holdings of treasury notes and bonds jumped from $2.03 trillion four months ago to $3.58 trillion last week; the rate of growth has decelerated but the Fed continues to accumulate these bonds (Chart 2).
If Chart 3 is anything to go by, it should continue to do so – inflation permitting, of course. Hence the significance of Chart 1.
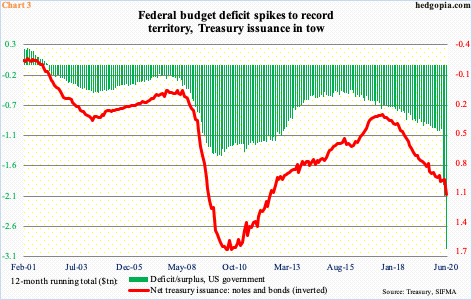
On so many levels, it is hard to come to terms with the green bars in Chart 3, but it is what it is. The federal budget deficit has gone parabolic. In the 12 months to June, the deficit was to the tune of $3 trillion. As recently as March, the red ink was $1.04 trillion. This has to be paid for, and for that the Treasury issues debt. The 12-month issuance of notes and bonds in June was $1.14 trillion. Given the low inflation – as well as the outlook – rates remain low. But markets will demand more the moment they sniff out inflation. Worse, in certain scenarios, the Fed may even have to shoulder a heavier burden of Treasury purchases. It is a cliché, but how inflation trends in the months to come will have far-reaching consequences for investors.
Thanks for reading!


