
Weighing The Week Ahead: Looking Beyond The Obviou
We have a small economic calendar, but another big week for earnings. Corporate earnings are not confirming those who thought the market was signaling a recession. Starved for something new to worry about, the punditry has turned to reductions in earnings estimates. This newfound interest in forward earnings provides another dimension for the gloomy set. Instead, I suggest that astute investors should consider the data while…
….looking beyond the obvious.
The obvious elements include some economic weakness in Q119 for a variety of well-known reasons. We should expect some earnings impact as a result.
Last Week Recap
In my last edition of WTWA I highlighted not only the abundance of data, but also the diversity of analytical methods to consider. Investors could review the “message” of the market, corporate earnings, the Fed, Washington events, or international threats to the economy. Alternatively, they could join me in emphasizing the trumped-up threats to the economy.
Most will summarize the week as a story about the Fed, but the other elements were also important. There really was no clear theme.
The Story in One Chart
I always start my personal review of the week by looking at a great chart. This week I am featuring Jill Mislinski. She includes a lot of relevant information in a single picture – worth more than a thousand words. Read the full post for more great charts and background analysis.

Stocks gained 1.6% on the week with a trading range of 3.4%. Much of the move came after Wednesday’s FOMC decision and announcement, although there was follow through for the rest of the week. You can see the volatility results and comparisons in our indicator snapshot (below).
Noteworthy and Fun
Check out Jason Zweig’s classic article, Super Bowl Indicator: The Secret History. Did you know that it began as a “satire on the fallibility of human statistical reasoning?” The inventor could not believe that it had been taken seriously, and tried to kill it in this letter. When the indicator went 11 for 11 before failing, he reports, “I did what any good statistician does: I broadened my statistical base until I got the numbers I wanted.”
According to the indicator, investors should be cheering for the Rams. I am still smarting from the injustice of the Saints’ loss. Mrs. OldProf will watch of course, despite the absence of her favorite team. She is skeptical that Michigan man Brady can do it once again.
The News
Each week I break down events into good and bad. For our purposes, “good” has two components. The news must be market friendly and better than expectations. I avoid using my personal preferences in evaluating news – and you should, too!
When relevant, I include expectations (E) and the prior reading (P).
New Deal Democrat’s high frequency indicators are an important part of our regular research. This week’s update shows all three time frames at close to neutral. NDD warns that the government shutdown is a big factor, so we really need a few more weeks of data before drawing important conclusions.
The Good
- The FOMC rate decision basically underscored recent statements from Fed members, but the reassurance led to a market celebration. The Fed will be patient in waiting for actual signs of inflation and flexible in the pace of balance sheet reaction. The Fed and the markets disagree over the strength of the economy and the significance of the continuing size of the balance sheet, but for now the Fed is in “calming” mode. Ace Fed watcher Prof. Tim Duy has a complete analysis of what happened, along with his own conclusions.
- Construction spending for November increased 0.8%, beating expectations of 0.3% and the prior month’s (upwardly revised) 0.1%.
- University of Michigan Sentiment was 91.2, slightly beating expectations and the prior read of 90.7.
- The ISM manufacturing index registered 56.6, beating expectations of 53.6 and a prior read of 54.3. The ISM’s own research shows that this reading, if annualized, is consistent with real GDP growth of 4%. Their report also provides interesting comments from respondents. Bespoke provides a table of the sector changes and comparison with past periods.

- New home sales for November were 657K (SAAR) beating expectations of 555K and the (upwardly revised) prior of 562K. Calculated Risk notes that we are nearly a month behind on this data because of the shutdown. He is looking for a weaker December and a rebound in January, based on conversations with builders. John Lounsbury and Steven Hansen (GEI) emphasize the need to look past the monthly report. Their analysis takes a deep look at the data, including a rolling average of year-over-year results.
-
Employment gains for January were excellent, consistent with solid economic growth. The net gain in non-farm payroll jobs of 304K should be viewed in the context of downward revisions of 70K in the prior two months. The result is still solidly higher than expectations of a 160K gain. The highlights:
- ADP private employment increased by 213K beating expectations of 170K. The prior month showed gains of 263K. I regard the ADP report, using different methods from the BLS, as an important source of confirmation for the “official” data.
- The unemployment rate increased to 4% from the prior 3.9%. This reflected an increase in labor force participation.
- Average hourly earnings increased only 0.1% versus expectations of 0.2% and a prior increase of 0.4%. This still represents a year-over-year increase of 3%, for the sixth straight month.
- Part-time Employment makes up a lower share of total private employment. (Scott Grannis).

The Bad
- Consumer confidence from the Conference Board declined to 120.2 missing expectations of 126.1. The prior reading was revised down from 128.1 to 126.6. Jill Mislinski updates the best chart of this series.

- Pending home sales declined 2.2%, worse than the prior month decline of 0.9% and missing expectations of 0.7% growth. Calculated Risk has the story.
- Initial jobless claims spiked to 253K. E 220K and P 200K. The government shutdown was the key factor, so it will take some time to see if there is a real change in claims.
- The 115th Congress functioned poorly over the last two years using the Bipartisan Policy Organization’s Healthy Congress Index. It was derelict in basic duties like days spent on legislative business, budget and appropriations, substantial committee process with the ability to offer amendments, and the amount of oversight.
The Ugly
The Foxconn saga. Bidding wars to attract private employers create a dilemma for political leaders. People focus on the announced job creation potential without a real cost-benefit analysis. Should Wisconsin be offering $3 billion in incentives for a facility that (originally) was supposed to require a $10 billion investment and employ 13,000, many in manufacturing jobs. The company announced last week that it would cut back and possibly shelve plans. Two days later, after some Trump arm-twisting, the plan is on again, although in a smaller form. (MarketBeat).
This is a complex subject, but interstate competition is not an overall winner for taxpayers.
The Week Ahead
We would all like to know the direction of the market in advance. Good luck with that! Second best is planning what to look for and how to react.
The Calendar
The calendar is a light one, but there will be earnings reports from 100 members of the S&P 500. I am mostly interested in auto sales and the ISM non-manufacturing index.
We can also expect an increase in political posturing reflecting the new Congressional divisions.
Briefing.com has a good U.S. economic calendar for the week. Here are the main U.S. releases.

Next Week’s Theme
Last week included improvement on several key market worries: the economy, the Fed, corporate earnings, and the government shutdown. Anyone who really believed that these were all important concerns might have expected a larger stock market rebound. Instead, there are already suggestions for replacement worries!
Investors need to be forward-looking. This includes more than a daily recitation of everything that might go wrong. The pundits may not help with this, but investors should be emphasizing –
Looking beyond the obvious.
Using earnings season as the main theme, I will suggest some easy ways to accomplish this goal.
- Use expected earnings in your market analysis. The most compelling reason is that it works better than either current earnings or formulaic analysis of past earnings. As earnings season unfolds, you see plenty of emphasis on guidance and outlook and little discussion of things that happened ten years ago. If this is how the market evaluates individual companies, why should we expect a different approach to the resulting broad averages? FactSet regularly runs this chart which shows the relevance of forward earnings for markets. Note that it is a constantly moving 12-month forward look, not the fixed calendar approach used by most sources.

- Choose the right time frame. Make sure it is related to your investment horizon. A good example was a story this week about plunging natural gas futures. Right in the middle of the polar vortex. Why? The weather report for next week called for higher temperatures. Anyone trading natural gas futures must trade in that time frame. But what about the long-term equity investor? Barron’s (to pick one source from many) has the decline in expected earnings as this week’s cover story. Jack Hough notes that Q119 earnings may decline by 1%.

FactSet notes that the median, bottom’s up estimate has declined by 4.1% during the first month of the quarter. A decline during the first month is normal, but the average over fifteen years is 1.7%. FactSet emphasizes continuing strong reports for Q418. Hough cites good reasons to believe that the full year will be better than the first two quarters.
I suggest that the first two quarters are the expected result of some unusual events – events which are now obvious. Unless you want to change your investment posture with the weather, take a longer look. Brian Gilmartin has a very nice table of earnings revisions by week, with a note about the major events. The table helps to illustrate what factors are at work in the earnings revisions. It also reminds us that there are always upward revisions in some stocks and sectors. Looking only at the net result overlooks important information.
-
Beware of a media emphasis on big stock reactions. This focus on the dramatic, easily understandable story is misleading. Mike Williams describes The Cycle That Triggers a Financial Crisis. He writes:
Surely the topic of “the next recession” is always a great piece for the financial media to cover because bad news tends to grab attention.
For example, CNBC recently posted a story entitled: “Five financial heavyweights weigh in on whether the next recession is nearing.”
This is precisely what happens when an earnings report generates a dramatic price move.
I’ll add a few more conclusions in today’s Final Thought.
Quant Corner
We follow some regular featured sources and the best other quant news from the week.
Risk Analysis
I have a rule for my investment clients. Think first about your risk. Only then should you consider possible rewards. I monitor many quantitative reports and highlight the best methods in this weekly update.
The Indicator Snapshot

Short-term trading conditions have improved to mildly bullish for technically-based methods. This is a good indication for short-term traders.
The technical background for long-term trading remains at “slightly bearish.”
Fundamental analysis remains strongly bullish. Earnings are excellent and the risk indicators are low. The overall investment climate has improved to “bullish.”
The Featured Sources:
Bob Dieli: Business cycle analysis via the “C Score.
Brian Gilmartin: All things earnings, for the overall market as well as many individual companies.
RecessionAlert: Strong quantitative indicators for both economic and market analysis.
Georg Vrba: Business cycle indicator and market timing tools. None of Georg’s indicators signal recession yet, but the unemployment rate indicator may give a signal soon.
Doug Short and Jill Mislinski: Regular updating of an array of indicators. Great charts and analysis.
Insight for Traders
Check out our weekly “Stock Exchange”. We combine links to important posts about trading, themes of current interest, and ideas from our trading models. This week, with no activity from our trading models, I focused on the question of when you should walk away from your trading. In addition to the mandatory advice from Kenny Rogers, I reviewed the history of Richard Dennis and the Turtles. This is a great story about nature or nurture, which investors will enjoy. It all started with a small bet, but hundreds of millions of dollars followed. We also provided sector ratings from Oscar and Felix, featuring the Russell 1000.
Insight for Investors
Investors should embrace volatility. They should join my delight in a well-documented list of worries. These are the best opportunities.
Best of the Week
If I had to recommend a single, must-read article for this week, it would be Ashby Daniels’s post, Should You Ignore Financial TV? The entire post is well worth reading, but here are the high spots:
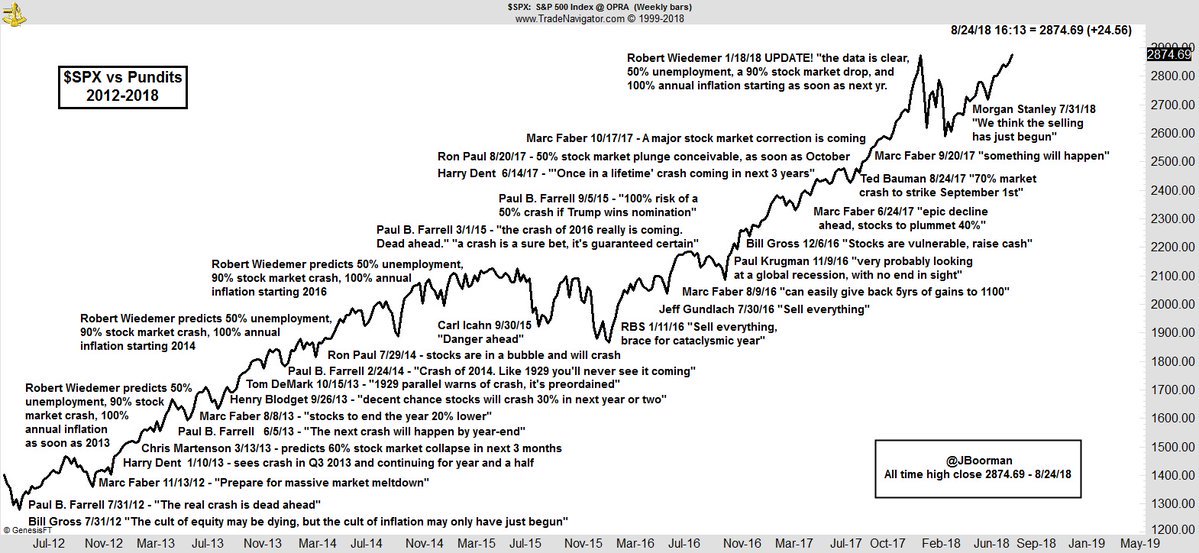
First, a long list of smart, noted experts have “incorrectly made market calls for what was surely broadcast as the apocalypse.” (large version here)
Second, market declines at the end of 2018 sent many in a rush to the exits.

And finally, if you can’t stop watching or reading financial commentary you are hardly alone. You should try what he calls a “lifeboat drill” making sure that you have enough assets safely held to assure the income you need.
Stock Ideas
Chuck Carnevale continues his series on bargain hunting in the wake of the 2018 stock declines. Turning to the communications sector, he finds five interesting candidates. As always, he provides an excellent lesson in fundamental analysis along the way.
Blue Harbinger likes New Residential (NRZ). A 13.8% yield comes with risk. Mark analyzes the business model, the recent price decline, and the variables affecting future returns.
Avi Salzman (Barron’s) analyzes the pricing pressure problems facing pharma. His list of companies in Congressional “crosshairs” and his recommendations are interesting places for your own research to start.
Morningstar suggests 10 Cheap Stocks With Growing Dividends. See the article for details about the methodology and also for stocks cut from their current dividend growth index.

Personal Finance
Seeking Alpha Senior Editor Gil Weinreich’s Asset Allocation Daily is consistently both interesting and informative. Each week he highlights stories of interest for both advisors and investors. This week I especially enjoyed his discussion of “when to sell,” and the idea that it was a stumbling block for man professional fund managers. He plays off of a post by Ploutos analyzing recent research on the subject.
Abnormal Returns is an important daily source for all of us following investment news. I read it daily, finding many good ideas. The Wednesday personal finance theme is of special interest for investors. Among the usual collection of excellent choices, I especially liked Trent Hamm’s lessons from the government shutdown. He has seven ideas – timely and practical advice.
Watch out for…
Gold. The Belle Curve takes a fresh look at gold. Blair was stimulated to write her update by the first question in an interview of a top investment advisor, Peter Mallouk: “So, what are your thoughts on gold?” She writes:
I thought we stopped talking about gold when Mr. T made an appearance on Bloomberg and talk radio became saturated with commercials urging us to buy gold in IRAs. But apparently gold remains a popular subject among investors, so I decided to revisit my thoughts on gold.
PG&E (PCG). The shares are rising despite the recent chapter 11 filing. The WSJ explains the risks.
Final Thought
If you missed my WTWA installment for last week, I urge you to go back and read the summary of methods and the “Final Thought.” In particular, those who followed the pundit-in-chief in finding an important message in the market decline were driven, once again, to sell at the bottom.
Briefing.com’s Big Picture column by Patrick J. O’Hare, is entitled Looking Back at the Market’s Test Run of a Recession-Minded Trade
provides a nice summary including plenty of charts. This is a good description of what happened, but Mr. O’Hare has the lesson wrong. He also includes some “indicators” that correlate with recessions. He warns against market timing.
A better lesson would be: Do not let the market be your indicator for economics. It is better to use economics (and resulting earnings) as an indicator for markets.
Earnings reports have put paid to the notion of a near-term recession, but that won’t last for long. I expect to hear plenty of talk about earnings “rolling over,” and the possibility of what some call an “earnings recession.” That has a nasty sound to it, but it does happen even in a period of overall growth.
Upside Risk
There are many sources highlighting downside risk in stocks, but few even mention the “upside risk” for those on the sidelines. Here are two takes on this topic:
FactSet monitors the bottom-up target price for the S&P 500 over the next twelve months. It is currently 3044, or a 12.6% increase from current levels. The analysts do not account for investor pessimism. They just look at the data for the companies they cover.
Davidson (via Todd Sullivan) is encouraged by vehicle sales and employment trends. Neither shows a sign of rolling over. He writes:
…we likely have at least a couple of years of continued economic expansion. What matters most is the high level of investor pessimism relative to economic and business fundamentals. There is a wide divide between current economic measures and investor perception. It is so wide that historical pricing suggests future SP500 levels couldreach higher than $4,000 in a few years should investor pessimism shift to historical levels of optimism. Even though markets have always ended with high levels of optimism, “euphoria” according to John Templeton, prices are dependent on market psychology. Market psychology will always remain unpredictable. The best we can do is to estimate the potential changes in market psychology and its impact.
Each time we see a market decline and rebound, many investors worry that they “missed their chance.” There is plenty of remaining time to profit if you look beyond the obvious near-term problems, which are falling away one-by-one.
[If you want some stocks that will participate in continuing economic growth or need a dependable method to generate income, send me a note. You might want to request some of my papers for individual investors, including those on Risk and Investor Pitfalls. Ask for my recent “client-only” paper on Lam Research. This company and many others will do just fine if the economy is merely reasonable. Just send an email to main at newarc dot com]
I’m more worried about:
- A new arms race. Withdrawal from the decades-old agreement with Russia is worth consideration, but the decision-making process is troubling. The classic approach is to build a consensus with your own experts and then bring allies on board. There is a reason why methods become “classic.” (The Economist).
- Mueller investigation issues. There are signs that a final report would not be public. This would not play well.
I’m less worried about
- Trade issues. The various small leaks are what we would expect from slow and gradual progress.
- The shutdown negotiations. I expect an agreement. No one will be a clear “winner,” but we’ll move on to more important issues.
We have a new (free) service to subscribers to our Felix/Oscar update list. You can suggest three favorite stocks and sectors. We report regularly on the “favorite fifteen” in each ...
more

