
Weekly Market Outlook - That Technically Ended The Bear Market. Will It Stick?
For a short while on Friday it looked like the week's budding rally effort was going to stall out. When push came to shove late in the session though, the bulls stepped up. While not every index cleared every possible hurdle, most of the indices have now cleared most of their most critical hurdles.

That's not a guarantee of a full-blown recovery from the bear market. It's still possible stocks could take a turn for the worst again. From an odds-making perspective though, the bulls have to like their odds a whole lot better than they did just a few days ago.
We'll take a detailed look at things below. First, let's recap last week's economic news and preview the biggies on the schedule for this week. Spoiler alert: There's a ton of stuff in the lineup that could move the market, including Friday's jobs report for January.
Economic Data Analysis
What a week, finalized with a blowout jobs report! But, first things first. In order of appearance...
The Conference Board's consumer confidence figure moved in the opposite direction as the University of Michigan's sentiment measure last month, perhaps prompting confusion. Then again, the Conference Board's number started out at a relatively high level, while the Michigan figure is still recovering from a huge plunge in the middle of last year. On balance (between the two), sentiment is mostly just so-so now... or was, anyway. We heard a wave of good/bullish news after both polls were already tabulated.
Consumer Sentiment Charts
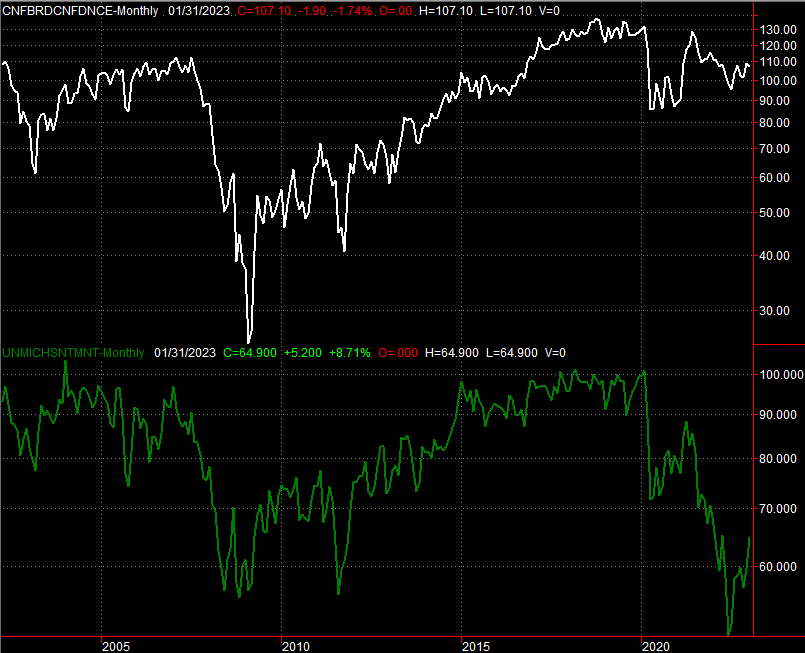
Source: University of Michigan, Conference Board, TradeStation
Home prices, however, fell despite moderately mediocre sentiment. Granted, this pullback is only as of November. Things certainly haven't improved since then though. If anything, home values have gotten weaker as more and more would-be buyers bow out.
Home Price Index Charts
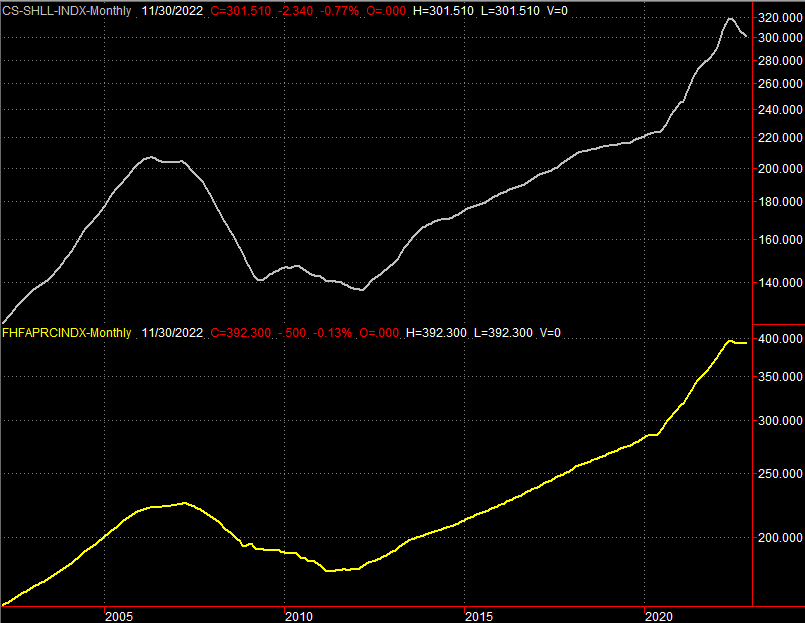
Source: Standard & Poor's, FHFA, TradeStation
We also got both ISM reports this week... manufacturing, and services. The manufacturing index was already below 50 and expected to move further below that level. It did, but by more than expected. Conversely, the services index was expected to edge up from 49.2 to back above the 50 mark with a reading of 50.3. Instead we saw a surge to 55.2.
ISM Services, Manufacturing Index Charts
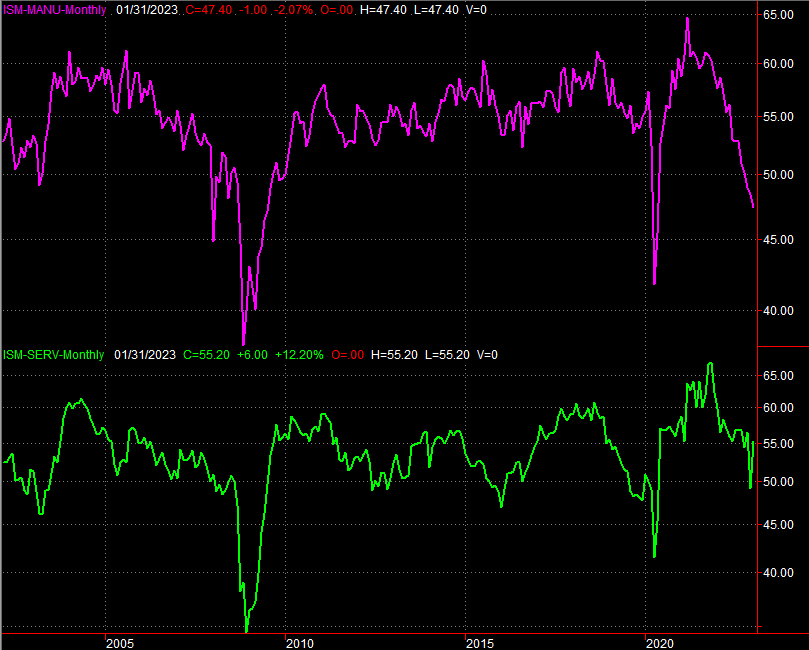
Source: Institute of Supply Management, TradeStation
This split is a little unusual, but not completely shocking. We're predominantly a service-based economy, after all, and last month had its economic bright spots. Either way, this data paints a confusing picture. Broadly speaking though, both data sets are still in bigger-picture downtrends.
The two biggest of the big reports from last week, however, were of course the Fed's decision regarding interest rates and January's jobs report.
In short, the Federal Reserve is decelerating its pace of rate hikes, from a recent handful of 50-basis point increases to only a quarter-point hike this time around. The FOMC still sees inflation, but also sees it's cooling. This messaging was a much-needed breath of fresh air to investors.
As for jobs, the U.S. added a whopping 517,000 new payrolls last month, blowing the expectation of 190,000 out of the water. December's number was also upped from 223,000 to 260,000. It was all enough to drive the unemployment rate down to a multi-decade low of 3.4%.
Payroll Growth, Unemployment Rate Charts
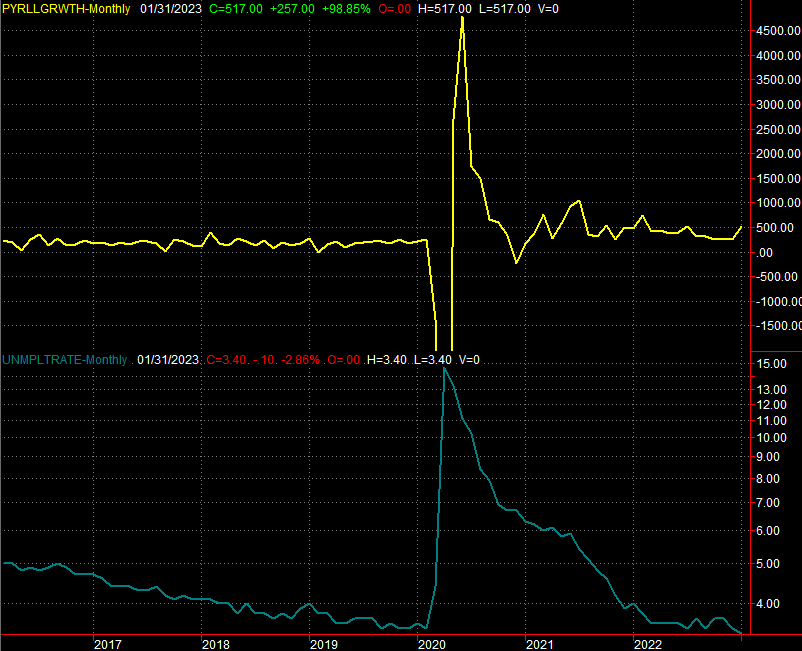
Source: Institute of Supply Management, TradeStation
Technically it's a good number... a great number, in fact. It's too good, actually, since it leaves the Fed a little more wiggle room to rekindle its previously-hot pace of rate hikes that would once again work against the market. Also notice that the average workweek became a little longer last month, and wage growth continues to be relatively robust despite several months of strong pay hikes. This poses the risk of fueling inflation.
Everything else is on the grid.
Economic Calendar
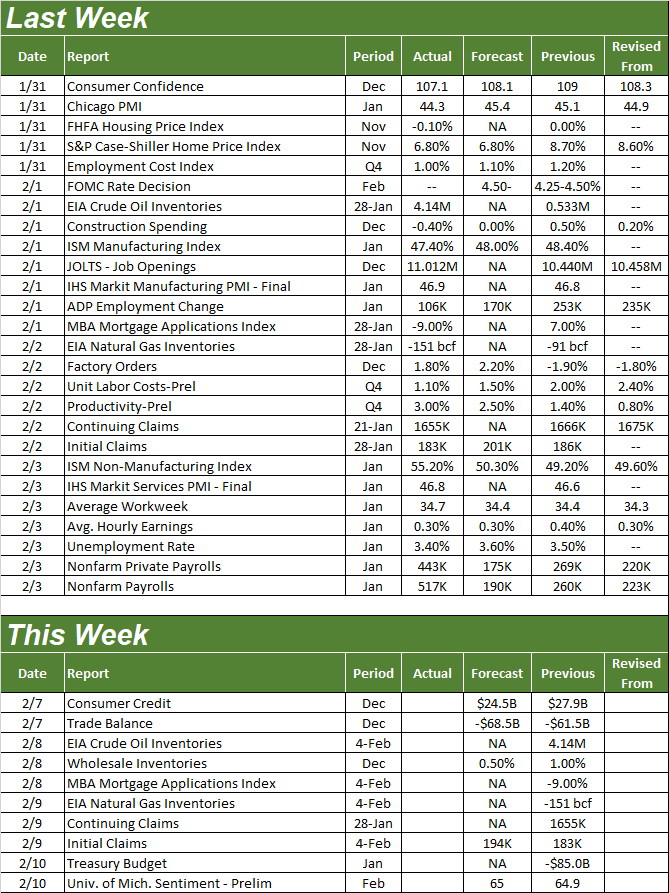
Source: Briefing.com
There are a few things in the lineup this week, but nothing worth previewing - it's just the way the calendar is working this month. It may be for the best either way, as it will let the market catch its breath and let traders dig into the beginning of the back half of earnings season. So far, it's been very mediocre.
Stock Market Index Analysis
The market ended the week on a low note. It just doesn't matter. Between Wednesday's and Thursday's (and Tuesday's) surges, stock still logged a big gain that carried almost all the indices well above key technical hurdles.
Take a look at the daily chart of the S&P 500 as an example. There was a ceiling at 4096. Now there's not. Even with Friday's 1.0% lull, the index still gained 1.6.% for the week... and that's with a lousy start on Monday.
S&P 500 Daily Chart, with VIX and Volume
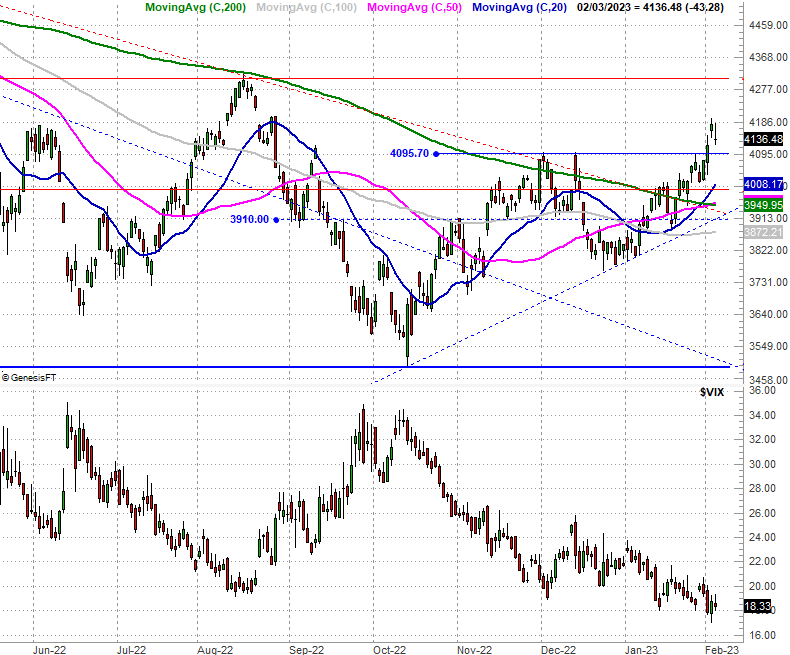
Source: TradeNavigator
The NASDAQ Composite took a pretty similar path. The index pushed its way above its technical ceiling at 11,552 a week ago, and renewed that breakout last week. It's also now well above the 200-day moving average line (green) at 11,466.
NASDAQ Composite Daily Chart, with VXN
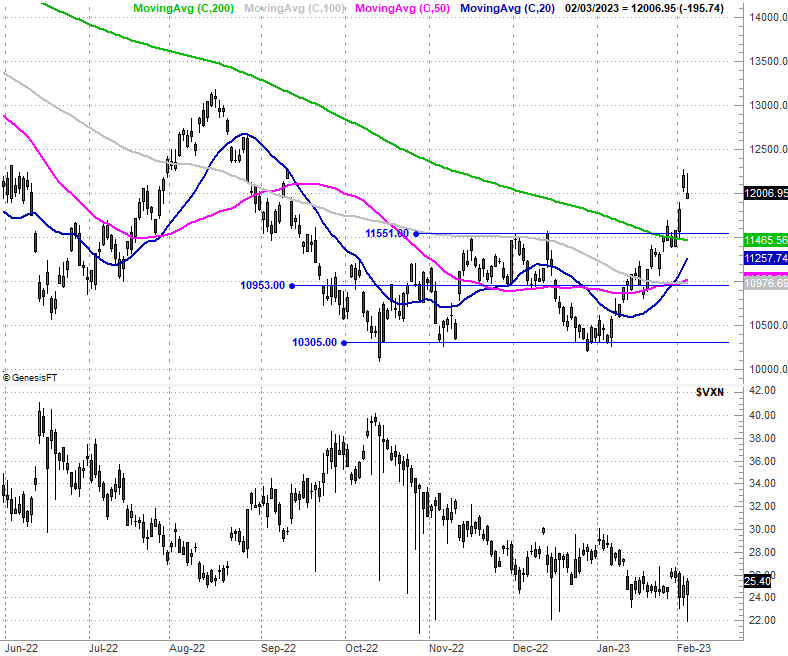
Source: TradeNavigator
The only index that didn't make all the technical progress we would have liked to see is the Dow Jones Industrial Average. It remained stuck under a horizontal ceiling (blue) at 34,288 as well as under the falling resistance line (gray, dashed) that's been a problem since November's peak.
Dow Jones Industrial Average Daily Chart, with Volume
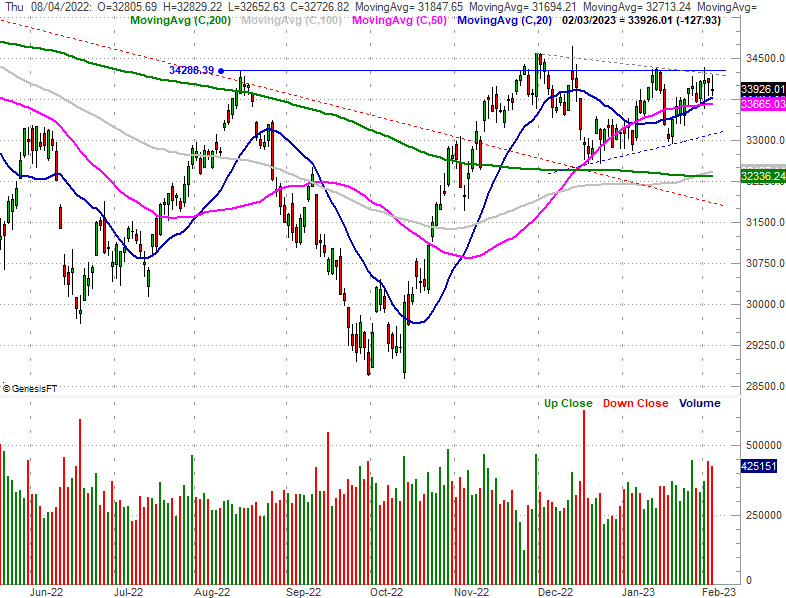
Source: TradeNavigator
On the surface this is concerning. But, perhaps it's not entirely surprising. We saw the Dow fare better than other indices last year, suggesting people were seeking out safety - in blue chips - while shunning aggressive tech and growth stocks. Now they're clamoring for growth and technology names, and aren't so interested in blue-chippy stocks. Either way, you have to like the way the Dow Jones Industrial Average is finding support at its 20-day (blue) and 50-day (purple) moving average lines.
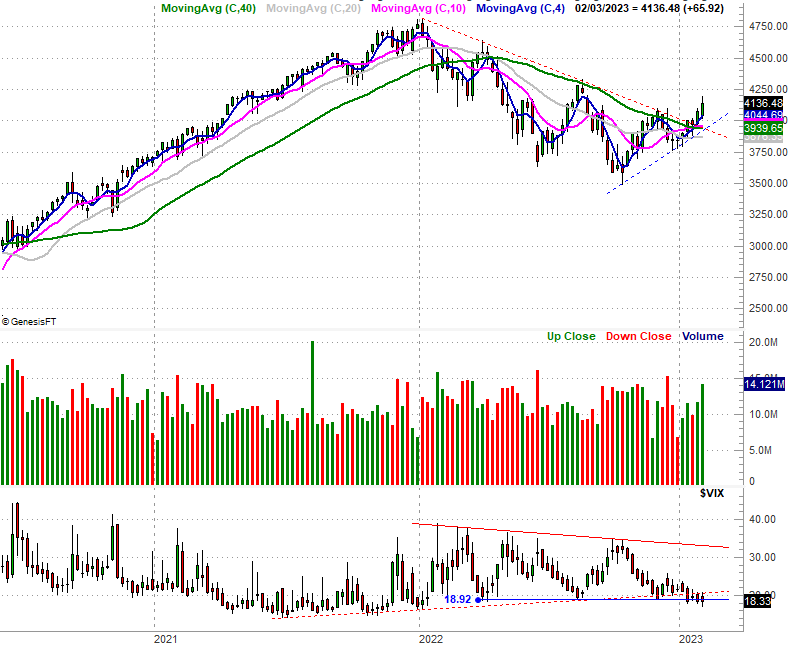
Backing out to the long-term weekly chart of the S&P 500 we can put the past few weeks' worth of bullishness in perspective. For the first time since 2021 we've actually followed a higher low with a higher high. Even if this doesn't make October's low the bear market low, this is a hint that investors are at least willing to give stocks some benefit of the doubt.
S&P 500 Weekly Chart, with VIX and Volume
Source: TradeNavigator
Notice the S&P 500's volatility index also finally edged under its support just under 19.0... something that had to happen to renew broad bullishness. There's not a lot of room left for the VIX to keep moving lower before a more absolute floor near 15.0 is hit. That has the potential to stymie a rally, although do know the market can rally for months on end while the VIX just drifts sideways at low levels. Just see 2021.
Bottom line? There's no denying this is a breakout thrust that technically ends the bear market. The problem is, it's nowhere close to being the ideal end to a bear market. Not only did the bear market not quite last long enough, it didn't end with a huge, capitulative plunge. It ended with a whimper. That's why we remain concerned we could still see such a final, bottom-making move in the foreseeable future.
Either way, we're expecting some profit-taking weakness this week. Don't freak out if and when we get it. There's plenty of technical support to stop and reverse any selling. Indeed, a little pullback might be what's best for the rally effort, allowing the bulls to regroup and renew the effort.
More By This Author:
Weekly Market Outlook - The Market Just Got Over the Hump... Mostly
Friday Is A Pivotal Day For The Market's Turnaround Effort
Weekly Market Outlook – On The Fence, Stuck In The Middle And Undecided


