
We May Be Looking At An Equity Market Blow-Off Stage, Getting More Proof To Position Downside
Summary
- Equities have risen further; yields rose too but reversed quickly. Biotech and Junk are being hammered. Divergent moves, but it's because equities could be in the final blow-off stage. We explain why.
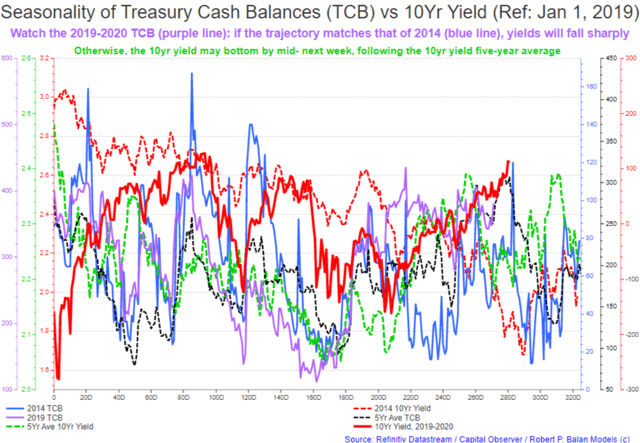
- Rising Treasury Cash Balance (TCB) was a reason why yields rose. It was no big deal - it's a historical pattern. But we should be seeing deeper yield declines soon.
- These developments may be significant, that's why PAM explores the thesis that the current rally is a blow-off phase, and if we get further proof, we will position downside, large.
- Investment banks and hedge funds bet on what the present-year TCB will be doing, and front-run the TCB's turns. The front-run on the 2019-2020 TCB seems to mimic its behavior in 2014-2015, when yields, from late January, fell quickly and deeply until mid-March.
- TCB and bank reserves' flows suggest that a significant SPX top is forming. Sharply falling yield may also undercut several market sectors. Another important lead indicator: monthly FedGov expenditures, the ultimate systemic liquidity source, is the prime mover of SOMA POMO transactions, and therefore, the prime mover of changes in the Fed's bank reserves. Its trend has been down for months.
Equities have risen further; yields rose too but reversed quickly. And the Biotech and Junk sectors are being hammered (see chart below). Divergent moves, but it's because equities could be in the final blow-off stage. If we interpreted these symptoms correctly, the equity bull rally should reverse lower soon. We explain why we believe this divergence is happening, and why it matters to the health of the equity markets.
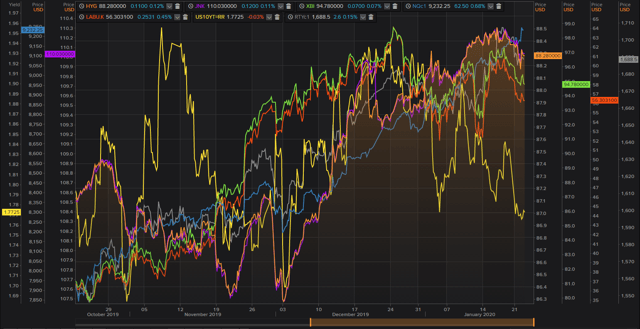
Sharply falling yields has a negative impact on some market sectors
Offhand, this the reason why we are seeing the divergence between the Biotech sector, along with High Yield, versus the Nasdaq 100. Biotech and High Yield have very high, positive covariance with the 10Yr yield. Most times, these sectors act like a proxy of the long bond yield (see chart below) rather than hew to the primary moves of the NFX 100. And that, on a structural basis, could become problematic to the underlying index.
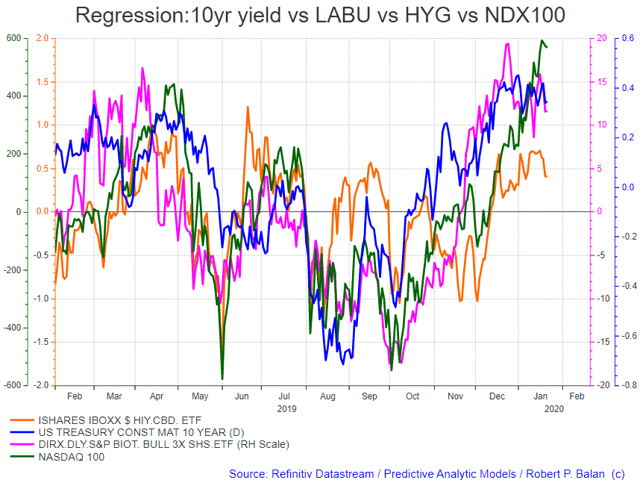
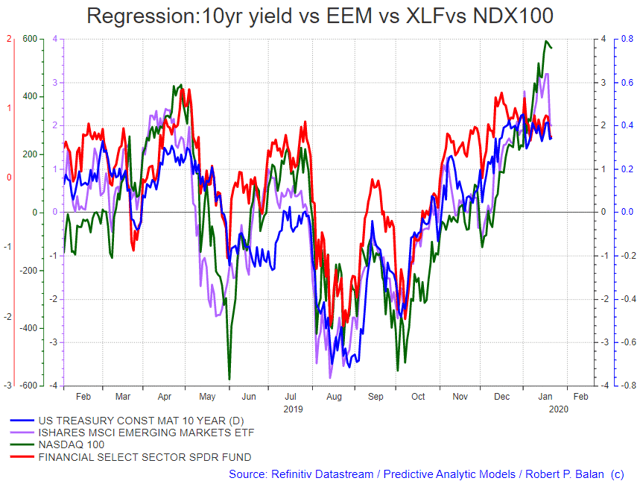
For one, if we are again correct in our assessment, bond yields are going to fall sharply over the next few days, even weeks. That will force these bond yield proxies lower, and presumably other sectors that fade when yields fall, like financials, a heavy-weight sector, which would pile on pressure on the Dow. On top of that, EM equities would front-run what would be subsequent undercutting of the major indices (see chart below).
Ironically, an equity market topping out may be eventually be forced by sharp decline in bond yields as adverse liquidity flows combine with a flight to safe-haven sentiment to trigger mean-reversion moves which will lower stock prices.
Investment bank, hedge fund front-run on the TCB keeps yields weak
In front-running the inflection points of the Treasury Cash Balances, investment banks and hedge funds basically bet on what the current-year TCB will be do - these Big Boys try to anticipate what the TCB will be doing several trading days from today, for instance. The institutions are doing that to have an edge in the bond market. This series has a very good track record of reflecting the systemic liquidity situation brought about by US Treasury expenditures transacted with non-commercial banks (see chart below), which is what the TCB does. And bond yields respond to the TCB's liquidity flows and turns beautifully.
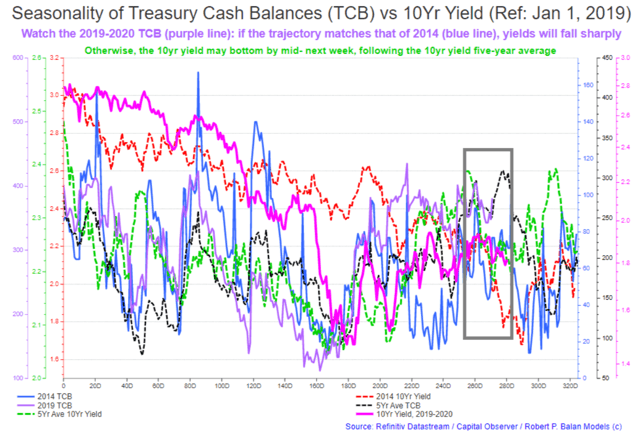
As I emphasized in recent PAM reports, we should be watching the TCB like a hawk on the assumption that we might just see another outlier event like that in 2014, when yields fell sharply from the current period and fell on a sustained basis until mid-March (see chart above). That behavior was triggered by the outlier behavior of the TCB at that time in 2014 (blue line, see chart above). The TCB fell earlier and on a much more sustained basis relative to the TCB's five-year average.
The chart clearly illustrates the possibility of a few days' rally in yields (when this was written on January 17, 2020) and a subsequent, sharp decline in yield over the next few weeks (dashed, orange line and blue line). If the current TCB mimics its 2014 performance, and if the investment banks and hedge funds front-run it accordingly, then bond yields should fall immediately from here and should do so until mid-March.
Applying the analytical method to the S&P 500 Index
Supposing we take the analytical platform used above for yields, simply substitute SPX for yields, and make the optics easier by detrending (normalizing) SPX so it would match the horizontal plane of the TCB seasonality. This is what we get (see chart below).
A sharp fall in bond yields, therefore, applies the same negative liquidity conditions to the equity markets. That is in addition to the negative effect of falling yields on several important market sectors.
You will see from the chart that the 2019-2020 SPX (and even the five-year SPX average) matches the TCB historical average very well. And the divergence between yields (current, and in 2014) and SPX is what made us note the possibility of an outlier performance in the yields in the first place.
We don't have to rely on outlier events - liquidity conditions are turning unfavorable
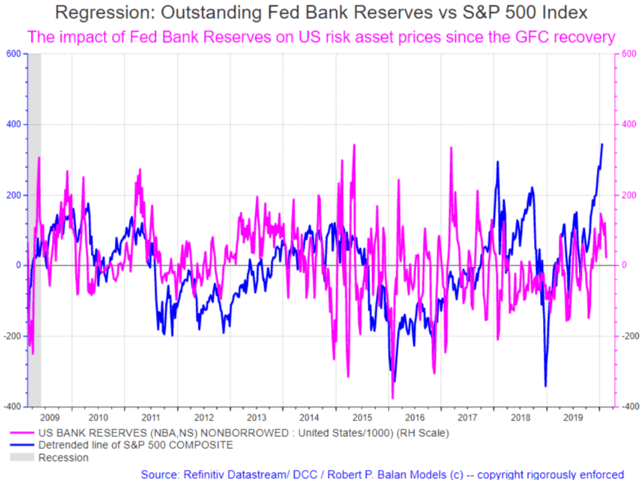
In and of themselves, liquidity providers are turning unfriendly to markets. For instance, ample bank reserves provided by the Fed's recent Permanent Open Market Operations (POMOs), which have triggered the current market rally (and other rallies in recent past), are close to an inflection point. We have to remember that it is the change rate of liquidity (its "flow") which has relevance to the change in risk asset prices. The change rate in bank reserves at the Fed has already fallen sharply (see chart below). If the relationship persists, then the SPX rally should soon start fading as well.
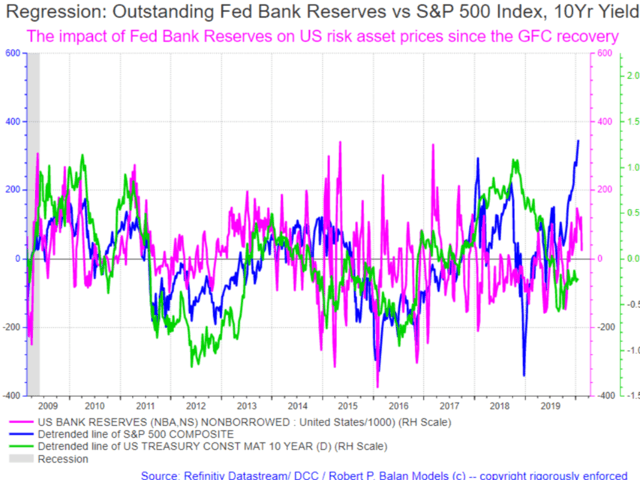
This is how it looks like if we add the 10Yr yield in the picture (10Yr yield also detrended for easier optics):
Here is a zoomed-in view:
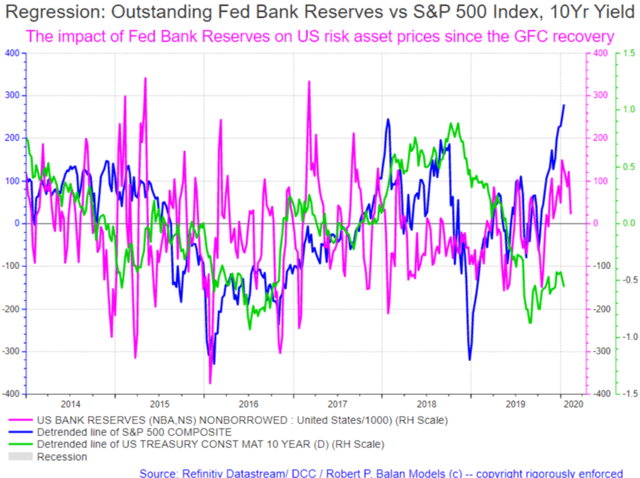
So far, both TCB and bank reserve liquidity flows (which have already been receding) suggest that a significant SPX top is in the making. For the 10Yr yield, the potential to the upside is severely constrained; we should see sharper decline in yields over the next few weeks.
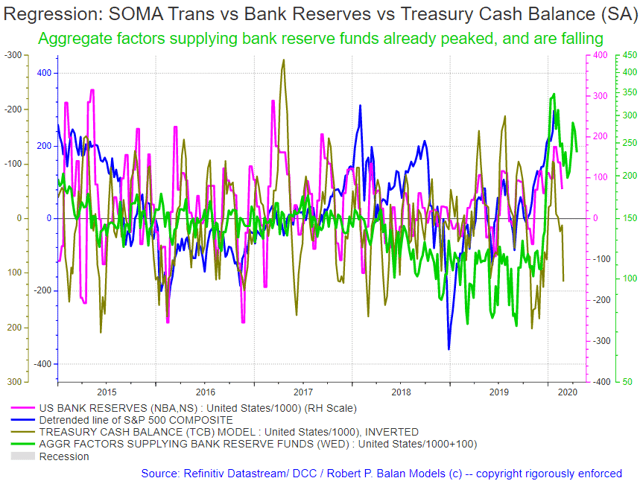
Factors affecting bank reserves
We also created a matrix for the factors that affect bank reserves, and here is what PAM gets.
Change rate of aggregate factors supplying bank reserve funds have already peaked and are now falling (green line, chart below):
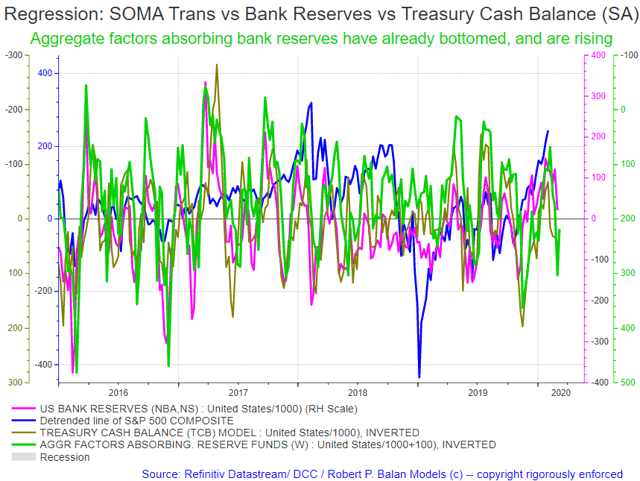
And the change rate of aggregate factors absorbing bank reserves has already bottomed and is now rising (green line, data plot inverted in the chart below):
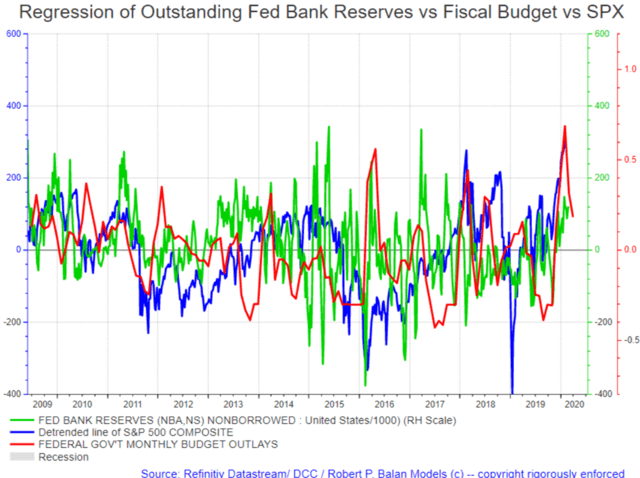
Here is another dimension.
We added the monthly Federal government expenditures outlay, which we described before as the ultimate liquidity source, as it is the prime mover of the SOMA POMO transactions and, therefore, the prime mover of the changes in the Fed's bank reserves.
Here is a zoomed-in view:
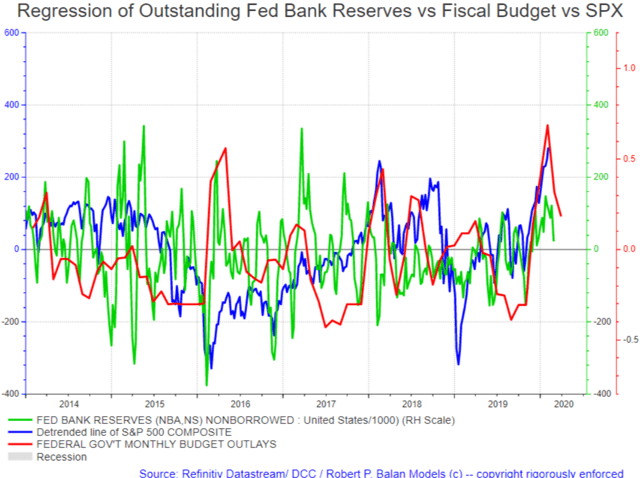
Conclusion
If the change rate of federal government expenditures is fading, then the primary generator of POMOs which create the bank reserves that the markets so crave as a measure of liquidity will not be there to bail the market out.
Therefore, bank reserves will fall significantly very soon. Falling bank reserves wreak havoc on risk asset prices and will depress bond yields.
All that remains now is tracking the incipient blow-off stage and timing the inflection point lower in risk asset prices and the continuing decline in bond yields. We have to tools to do that too and will publish when we see it happening.
Disclosure:
I am/we are long BONDS, GOLD, EURO.
I wrote this article myself, and it expresses my own opinions. I am not receiving compensation for ...
more

