
VIX Peels Back As S&P 500 Stabilizes; High Volatility Still A Threat
The stock market selloff since mid-February has pushed the S&P 500 Index 30% lower from its all-time record high just below the 3,400 level. Despite aggressive action from the Federal Reserve and Trump administration to stimulate the economy, which are aimed at offsetting the economic cost of the coronavirus pandemic, bearish sentiment continues to steer stocks lower.
In fact, the stock market rout recorded over the last five trading sessions caused the S&P 500 Index to drop by 15% for its biggest weekly decline since October 2008 amid the global financial crisis. As global central banks and governments announce efforts to counter the novel coronavirus outbreak, however, the slide in stocks could start to decelerate.
QUADRUPLE WITCHING PRESSURES VIX ‘FEAR-GAUGE’ LOWER DESPITE DEEPER STOCK MARKET SELLOFF
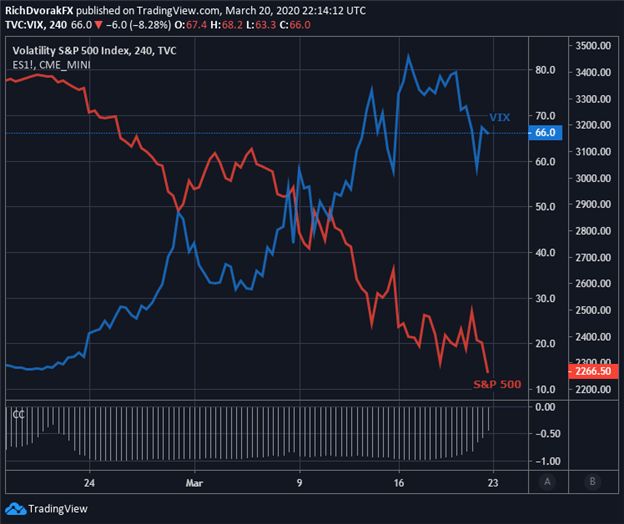
Chart created by @RichDvorakFX with TradingView
Following the parabolic rise in the VIX Index to crisis-level highs over the last three weeks, the popular fear-gauge has started to pull back from near-record readings. A higher VIX reading tends to indicate a higher degree of uncertainty and risk surrounding the direction of the S&P 500 Index over the next 30-days. As such, there is generally a strong inverse correlation between the S&P 500 and the VIX Index.
Although, the retracement lower in the VIX Index might be explained partly by the technical impact of quadruple witching volatility as traders roll their expiring options and futures contracts. Also, other cross-asset volatility benchmarks suggest more pain could be ahead for stocks and other risk assets.
VIX INDEX PRICE CHART OVERLAID WITH FX VOLATILITY, OIL VOLATILITY & HIGH YIELD VOLATILITY
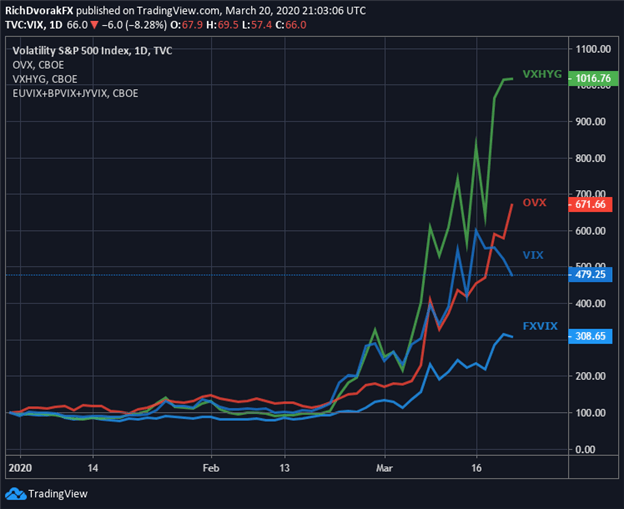
Chart created by @RichDvorakFX with TradingView
As recession risk intensifies amid the worsening coronavirus pandemic and a confounding plunge in crude oil prices, the latest surge in cross-asset volatility is likely here to stay. Two volatility benchmarks reflecting 30-day implied volatility for crude oil and high yield corporate bonds, OVX and VXHYG, still linger around their highest readings on record while FX volatility climbs.
VOLATILITY IN HIGH YIELD CORPORATE BONDS SPELLS TROUBLE FOR THE S&P 500
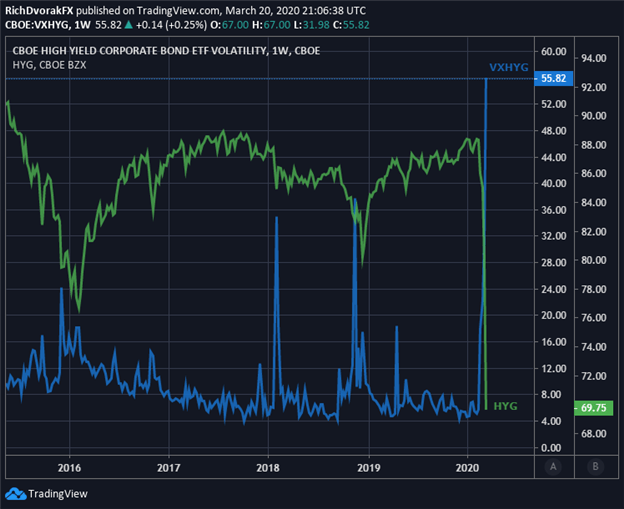
Chart created by @RichDvorakFX with TradingView
The recent crash in crude oil and rekindled recession risk, which is likely fueling the rise in default risk faced by a significant portion of high-yield corporate bonds and CLO market, has caused VXHYG to slingshot to its highest reading on record. At the same time, the iShares High Yield Corporate Bond ETF (Ticker Symbol: HYG) crumbled at its fastest rate since – you guessed it – October 2008.
That said, VXHYG might stay elevated as credit markets remain under serious strain and could keep the VIX Index relatively anchored to these financial crisis-high levels of volatility. Correspondingly, the direction of high-yield corporate bonds, VXHYG and the VIX have potential to serve as a bellwether to where the S&P 500 Index heads next.


