
You Won’t Find A Bargain With This Car Dealer
With the S&P 500 hitting all-time highs, many investors are looking to lower risk in their portfolios. They should start by eliminating extremely risky holdings. As we covered recently, stocks like Tesla (TSLA) and Wayfair (W) present extreme levels of risk despite their excellent price performance. Fiduciaries need more than price momentum to justify investing in a given stock. This week, we’re featuring another stock where the hype has hit unprecedented heights. Fiduciaries should avoid Carvana (CVNA).
Since we warned about the firm in April 2019, the stock is up ~192% (including a ~121% gain year-to-date) while the S&P 500 is up just 18%. Investors who think that such extraordinary performance in the stock coincides with accelerating revenue growth, improved profitability, or growing competitive advantages are wrong. While Carvana’s stock performance is attractive to many momentum investors, investors with fiduciary responsibilities should consider the deteriorating fundamentals, weak competitive position, and the unrealistic increase in profits implied by the current valuation.
This report helps investors of all types see just how extreme the risk in CVNA is based on:
- Slowing revenue growth and expanding losses
- Bigger and more profitable competitors
- Doing the math: even Carvana doesn’t believe the revenue and profit growth implied by the current valuation
Carvana Is New, But Not Unique
Many investors believe Carvana is a budding e-commerce giant poised to disrupt an antiquated market. Promising a touchless delivery process, nationwide inventory, no haggle pricing, a transaction process that can be completed within 10 minutes, and even a car vending machine, Carvana creates a feeling of a new way of doing business.
However, this new way of doing business is more style than substance, and can easily be replicated by incumbents. CarMax (KMX) already sells cars online and has customers sign the final paperwork upon arrival (same as Carvana). Carvana, at its core, is a car dealership with easily replicable competitive advantages, if any. Like all other dealers, Carvana must source vehicles, manage inventory, attract customers, and sell cars for more than they paid for them.
Carvana hopes its vertical integration and hands-off selling process will create greater selection for consumers, higher margins, and a more satisfying customer experience. However, when compared to peers, such as CarMax (KMX), it is difficult to see exactly where any advantage lies. Like CarMax and other dealers, Carvana sources its inventory primarily through auction markets and customers, and e-commerce isn’t the disruptive sales channel some would have you believe.
E-commerce Is Not A Sustainable Advantage
While physical stores can create a costly drag on traditional retailers’ operations, car dealerships benefit greatly from physical locations. According to the Edmunds.com Millennial Mobile Car Shopping Report, 96% of millennials say it is important to test drive a vehicle before driving. Unlike Carvana, CarMax is able to reach various customer groups with its omnichannel model. Customers can choose to complete the entire purchase process online, in the store, or some combination of the two.
CarMax, with its nationwide footprint, also has a larger inventory and is able to offer customers more flexibility and options throughout the sales process than Carvana.
CarMax is not the only competition Carvana faces. Many traditional auto dealers have embraced e-commerce to enhance the buying experience and grow revenue.
Penske Automotive Group (PAG) offers consumers tools to research the firm’s inventory within a specified mileage radius. Firms such as TrueCar (TRUE) already partner with dealerships to offer inventory on the internet as well.
Should Carvana become more successful, it would become more difficult to stand out from the competition. Nothing stops other dealers from adopting Carvana’s e-commerce practices while leveraging existing inventory and distribution advantages.
Unsustainable Growth Rates and a Saturated Market
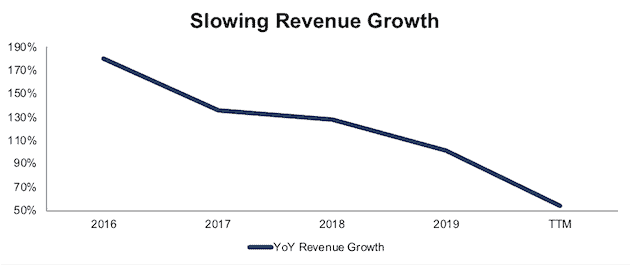
Carvana’s car vending machines and advertising have helped the firm enjoy remarkable revenue growth since 2015. However, revenue growth is quickly falling, per Figure 1. Carvana’s YoY revenue growth has slowed from 181% in 2016 to 101% in 2019, and 54% over the TTM period.
Figure 1: Carvana’s YoY Revenue Growth Rate Since 2016
Sources: New Constructs, LLC and company filings
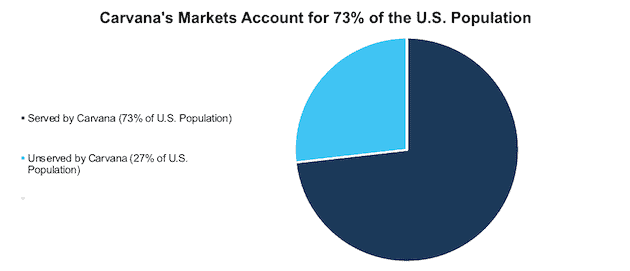
Much of Carvana’s revenue growth is driven by expanding into new markets. However, Carvana is quickly running out of geographic areas into which it can expand. Since beginning in 2013 in one market, the firm has expanded its operations to 261 markets as of 2Q20. Per Figure 2, the population of these 261 markets account for 73% of the total U.S. population, which leaves just 27% of the market available for future expansion.
Figure 2: Carvana’s 261 Markets Account for 73% of Total U.S. Population
Sources: New Constructs, LLC and investor relations
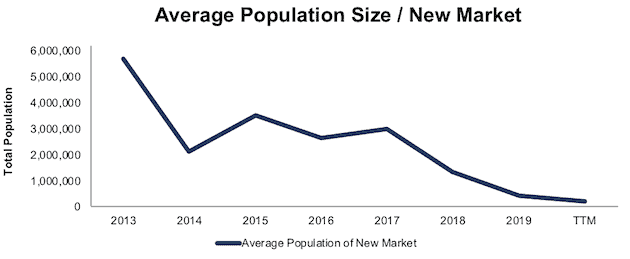
In addition, further expansion will likely not be as fruitful because the average population size of the untapped markets drops from 3.5 million in 2015 to just 213 thousand TTM. Figure 3 illustrates how Carvana is expanding into locations that serve fewer consumers.
Figure 3: Average Population of Carvana’s New Markets Since 2013
Sources: New Constructs, LLC and company filings
Operating Efficiency Is Declining
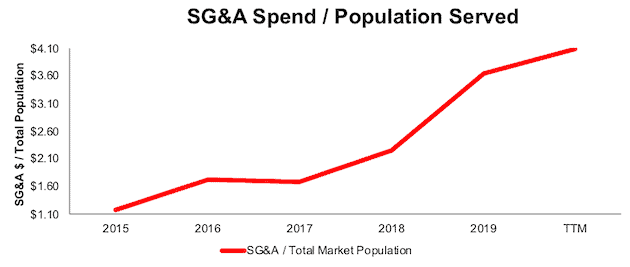
As the firm enters smaller markets, operating efficiency declines. Figure 4 illustrates how Carvana’s SG&A spending has increased from $1.18 / person in 2015 to $4.10 / person TTM in its operating markets.
Figure 4: SG&A Spent / Operating Market Population
Sources: New Constructs, LLC and company filings
Carvana Faces Heavy Competition
A plethora of local dealers have established existing distribution networks and large inventory available for immediate test driving. Additionally, Carvana faces direct competition from CarMax and its omnichannel model. These competitors present a strong headwind for the firm’s future growth.
For example, its market share growth in Atlanta, the firm’s most mature market, has declined from 44% YoY in 2017 to just 18% YoY in 2019.
Atlanta is likely a good proxy for what the firm’s 260 other markets face as they mature.
Figure 5: Carvana’s YoY Share of Atlanta Market Growth Rate
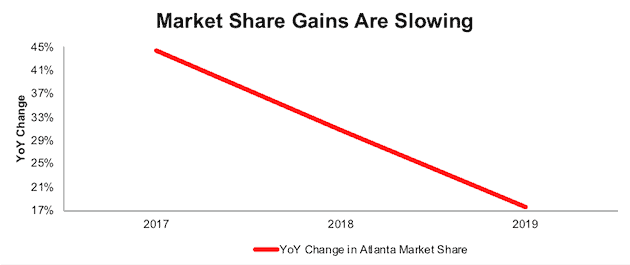
Sources: New Constructs, LLC, and company filings
Competition Is Much More Profitable
Carvana’s expansion plans are further hampered by the firm’s lagging profitability. While Carvana’s net operating profit after-tax (NOPAT) margin has improved from -26% in 2015 to -9% TTM, it remains well below all of its competitors and peer group, per Figure 6.
Peers include CarMax Inc., Lithia Motors, Inc. (LAD), AutoNation Inc. (AN), Penske Automotive Group, Inc., KAR Auction Services, Inc. (KAR), Asbury Automotive Group, Inc. (ABG), Sonic Automotive, Inc. (SAH), Group 1 Automotive, Inc. (GPI), Cars.com Inc (CARS), TrueCar, Inc., and America's Car-Mart, Inc. (CRMT).
Carvana’s invested capital turns, a measure of balance sheet efficiency, are better than its peer group. The firm’s invested capital turns improved from 0.8 in 2015 to 2.4 TTM while its peer group’s TTM invested capital turns improved from 2.1 to 2.2 over the same time.
Carvana’s superior capital efficiency is not enough to offset its highly negative margins, however. The firm has never generated positive NOPAT in any year of our model (dates back to 2015), and Carvana’s return on invested capital (ROIC) has only slightly improved from -22% in 2015 to -21% TTM. Meanwhile the firm’s peer group market-cap-weighted average ROIC improved from 8% to 10% over the same time.
Figure 6: Carvana’s NOPAT Margin, Invested Capital Turns, and ROIC vs. Peers
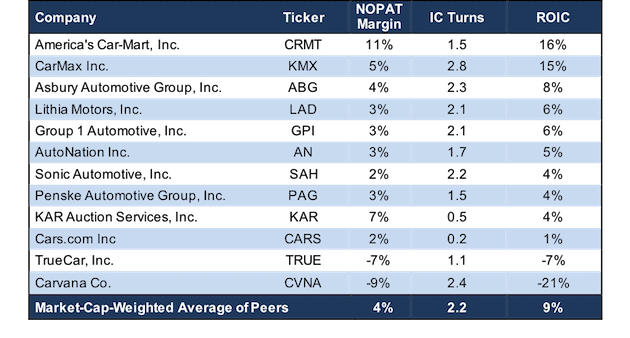
Sources: New Constructs, LLC, and company filings
Carvana’s Losses Are Growing Too
The hope for a high growth company is that it will eventually gain efficiencies through economies of scale and become profitable. Carvana does not appear to be heading in that direction, yet. Per Figure 7, Carvana has grown revenue by 138% compounded annually since 2015. Carvana’s rapid revenue growth has come with little regard for actual profits. Carvana’s core earnings[1] have fallen from -$40 million in 2015 to -$134 million over the trailing-twelve-months (TTM).
Figure 7: Carvana’s Revenue & Core Earnings Since 2015
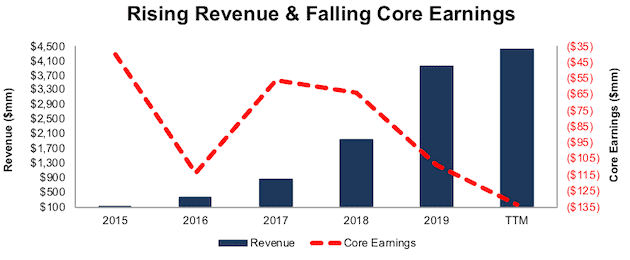
Sources: New Constructs, LLC, and company filings
Carvana Is Also Burning Through Cash
Carvana has a history of significant free cash flow (FCF) burn that is unlikely to change anytime soon. Since 2016, the firm has burned a cumulative $2.4 billion (7% of market cap) in FCF. What’s worse, the firm’s FCF burn is accelerating. Carvana burned $1.7 billion in FCF in the last two years combined and $1.3 billion in the TTM period. At the end of 2Q20, Carvana had $1.1 billion of committed liquidity resources including $246 million of cash and cash equivalents. At its current FCF burn rate, the firm has enough cash to operate for eleven months before running out or diluting its investors by raising more capital.
Even Carvana Doesn’t Believe the Expectations Implied by Its Price
Despite the deteriorating fundamentals and tougher competition, Carvana is priced as if it will grow larger than the combined revenues of its peer group.
To justify its current price of ~$203/share, Carvana must:
- Grow revenue at 40% (vs. consensus estimates of 34% in 2020, 46% in 2021, and 34% in 2022) compounded annually over the next decade
- Immediately achieve a 4% (equal to peer group TTM margin) NOPAT margin (compared to -9% TTM)
See the math behind this reverse DCF scenario. In this scenario, Carvana’s revenue in 2029 would reach $114 billion, which is 11% greater than the combined TTM revenue of each of the firms listed in Figure 6.
Last year, Carvana generated a total of $3.9 billion in revenue and sold 217 thousand combined retail and wholesale vehicles – or $18 thousand in revenue per unit sold. Assuming inflation of 3.5% per year, revenue per unit sold in 2029 would be ~$26 thousand, at which point, the firm would need to sell ~4.5 million retail and wholesale vehicles to achieve $114 billion of revenue.
Such a high number would probably shock even Carvana’s optimistic CEO, Ernest Garcia III, who stated last year, “we believe we can sell two million cars per year.” Not only does the current price imply the firm sells more than twice the number of cars the CEO expects, it also implies the firm takes 9% of the current market share. For reference, CarMax, the largest used car dealer in the U.S. holds just 2% of the market.
Figure 8 shows the NOPAT growth expectations baked into the stock price compared to the firms historical NOPAT. In this scenario, Carvana will grow NOPAT from -$272 million in 2019 to $4.8 billion in 2029.
Figure 8: Current Valuation Implies Unrealistic NOPAT Growth
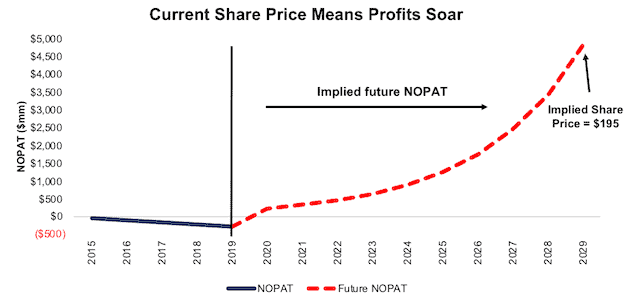
Sources: New Constructs, LLC and company filings.
In this scenario, Carvana’s NOPAT reaches $4.8 billion (vs. -$378 million TTM) in 2029 or ~10 years.
Significant Downside Even If the CEO Is Right
Even if we assume Carvana can achieve the CEO’s goal of becoming a 2 million car per year firm, CVNA has significant downside risk. In this scenario, Carvana must:
- Grow revenue by 34% in 2020, 46% in 2021, and 34% in 2022 (consensus estimates) and by 26% per year each year thereafter
- Immediately achieve a 4% (equal to peer group TTM margin) NOPAT margin
See the math behind this reverse DCF scenario. In this scenario, Carvana grows NOPAT from -$272 million in 2019 to $2.2 billion 10 years from now and the stock is worth just $83/share today – an 59% downside. In this scenario, the firm grows revenue to $52 billion in 2029. If we assume, as we did in the previous scenario, that Carvana will generate ~$26 thousand / car sold in 2029, then the firm reaches its 2 million car / year goal a decade from now.
Figure 9 compares the firm’s implied future NOPAT in this scenario to its historical NOPAT.
Figure 9: Carvana Has Large Downside Risk: DCF Valuation Scenario
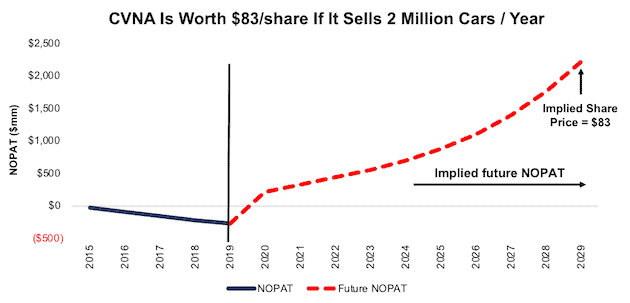
Sources: New Constructs, LLC and company filings.
Acquisition Would Be Unwise
Often the largest risk to any bear thesis is what we call “stupid money risk”, which means an acquirer comes in and pays for Carvana at the current, or higher, share price despite the stock being overvalued. While we think competitors would be better suited to adapt their current models to meet consumer demand, its plausible that a competitor could decide to buy Carvana rather than build out their own e-commerce platform. However, given the highly negative margins and overvalued stock price, we think it would be unwise for a larger firm to acquire Carvana at current levels.
The likelihood of someone acquiring Carvana is further reduced by the low barriers to entry in e-commerce. The firm does not have a substantial technological or logistical advantage which means other firms can replicate its business model easily and less expensively. Nevertheless, we think it helps to quantify what, if any, acquisition hopes are priced into the stock.
Walking Through the Acquisition Math
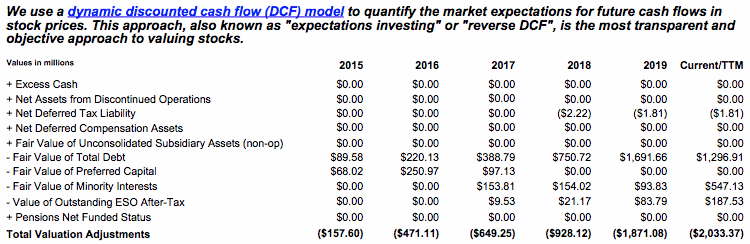
First, investors need to know that Carvana has large liabilities that make it more expensive than the accounting numbers would initially suggest.
- $547 million in minority interests (2% of market cap)
- $188 million in outstanding employee stock options (1% of market cap)
After adjusting for these liabilities, we can model multiple purchase price scenarios. For this analysis, we chose CarMax (KMX) as a potential acquirer of Carvana since acquiring a smaller firm would instantly boost its e-commerce presence. While we chose CarMax, analysts can use just about any company to do the same analysis. The key variables are the weighted average cost of capital (WACC) and ROIC for assessing different hurdle rates for a deal to create value.
Even in the most optimistic of scenarios, Carvana is worth less than its current share price.
Figures 10 and 11 show what we think CarMax should pay for Carvana to ensure it does not destroy shareholder value. There are limits on how much CarMax should pay for Carvana to earn a proper return, given the NOPAT or free cash flows being acquired.
Each implied price is based on a ‘goal ROIC’ assuming different levels of revenue growth. In both scenarios, the estimated revenue growth rate is 34% in year one and 46% in year two, and 34% in year three, or equal to consensus. In the first scenario, we assume revenue grows 34% in years four and five, the same as year three. In the second scenario, we use 40% growth in years four and five to illustrate a best-case scenario where we assume Carvana could grow revenue faster within the larger distribution network, resources, and customer base of CarMax.
We conservatively assume that CarMax can grow Carvana’s revenue and NOPAT without spending any working capital or fixed assets beyond the original purchase price. We also assume Carvana achieves a 5% NOPAT margin, which equals CarMax’s TTM NOPAT margin. For reference, Carvana’s TTM NOPAT margin is -9%.
Figure 10: Implied Acquisition Prices for Value-Neutral Deal
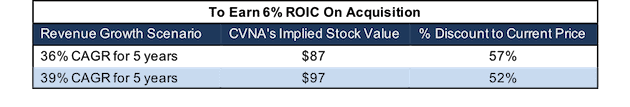
Sources: New Constructs, LLC and company filings
Figure 10 shows the implied values for CVNA assuming CarMax wants to achieve an ROIC on the acquisition that equals its WACC of 5.8%. This scenario represents the minimum level of performance required not to destroy value. Even if Carvana can grow revenue by 36% compounded annually for five years a 5% NOPAT margin, the firm is worth much less than $203/share. It’s worth noting that any deal that only achieves a 5.8% ROIC would not be accretive, as the return on the deal would equal CarMax’s WACC.
Figure 11: Implied Acquisition Prices to Create Value
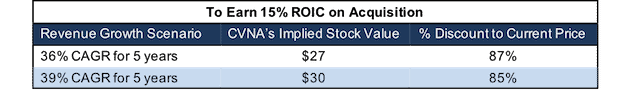
Sources: New Constructs, LLC and company filings
Figure 11 shows the implied values for CVNA assuming CarMax wants to achieve an ROIC on the acquisition that equals15%, its current ROIC. Acquisitions completed at these prices would be truly accretive to CarMax’s shareholders. Even in this best-case growth scenario, the implied value is significantly below Carvana’s current price. Without significant increases over the margins and revenue growth assumed in this scenario, an acquisition of CVNA at its current price destroys significant shareholder value.
Catalyst: COVID-19 Tailwinds Are Slowing
While shares have soared in the past several months, sooner or later, fiduciaries are compelled to consider the underlying fundamentals of the business.
As any used car dealer, Carvana is dependent upon trades-ins as a key source for its inventory. However, according to automotive research provider Cox Automotive, used-car inventory fell below 2.2 million vehicles in late July, which was down 22% from the prior year. Dealers across the country, including Carvana, are struggling to keep up with their inventory. As consumers travel less, there is less need to trade-up to a newer car, and, therefore, less need to trade-in or sell their existing vehicles. As Carvana struggles to source vehicles at a large enough scale, investors could realize Carvana’s path to profitability is only getting tougher.
What Noise Traders Miss With CVNA
These days, fewer investors pay attention to fundamentals and the red flags buried in financial filings. Instead, due to the proliferation of noise traders, the focus tends toward technical trading tends while high-quality fundamental research is overlooked. Here’s a quick summary for noise traders when analyzing CVNA:
- Core earnings are highly negative and declining
- Unsustainable revenue growth rate
- Low barrier of entry for incumbents to adopt Carvana’s business model
- Valuation implies Carvana will sell more than two times its own goal of two million cars per year
Executive Compensation Doesn’t Help Shareholders
Unfortunately for investors, Carvana’s executive compensation plan does not create direct links to the creation of shareholder value. Instead, it focuses executives’ interests on the share price and EBITDA.
82% of the firm’s executive compensation is long term and comes in the form of stock options and restricted share units (RSUs). Stock options comprise 52% of all executive compensation that appreciate in value with the firm’s stock price. Carvana’s RSUs are tied to an EBITDA performance goal.
Without significant changes to its executive compensation, Carvana is incentivized to boost top-line growth numbers with no attention to prudent capital stewardship. We’d recommend the firm’s compensation committee tie pay to improving ROIC, which is directly correlated with creating shareholder value.
Insider Trading and Short Interest
Over the past three months, insiders have purchased 899 thousand shares and sold 891 thousand shares sold for a net effect of 9 thousand shares purchased. These purchases represent less than 1% of shares outstanding.
There are currently 18.7 million shares sold short, which equates to 11% of shares outstanding and two days to cover. The number of shares sold short has declined by 7% since last month.
Critical Details Found in Financial Filings by Our Robo-Analyst Technology
As investors focus more on fundamental research, research automation technology is needed to analyze all the critical financial details in financial filings as shown in the Harvard Business School and MIT Sloan paper, "Core Earnings: New Data and Evidence”.
Below are specifics on the adjustments we make based on Robo-Analyst findings in Carvana’s 10-Q and 10-K:
Income Statement: we made $343 million of adjustments, with a net effect of removing $157 million in non-operating income (4% of revenue). You can see all the adjustments made to Carvana’s income statement here.
Balance Sheet: we made $1.1 billion of adjustments to calculate invested capital with a net increase of $230 million. One of the most notable adjustments was $41 million in operating leases. This adjustment represented 8% of reported net assets. You can see all the adjustments made to Carvana’s balance sheet here.
Valuation: we made $2 billion of adjustments with a net effect of decreasing shareholder value by $2 billion. There were no adjustments that increased shareholder value. Apart from total debt which includes the operating leases noted above, the most notable adjustment to shareholder value was $547 million in minority interests. This adjustment represents 2% of Carvana’s market cap. See all adjustments to Carvana’s valuation here.
Unattractive Funds That Hold CVNA
The following funds receive our Unattractive-or-worse rating and allocate significantly to CVNA.
- Morgan Stanley Discovery Portfolio (MACGX) – 3.5% allocation and Very Unattractive rating
- Fidelity Advisor Growth Opportunities Fund (FAGAX) – 3.0% allocation and Unattractive rating
- ClearBridge Select Fund (LCLTX) – 2.8% allocation and Very Unattractive rating
- Morgan Stanley Insight Fund (MCRTX) – 2.7% allocation and Very Unattractive rating
- Morgan Stanley Growth Portfolio (MGHRX) – 2.7% allocation and Very Unattractive rating
- Transamerica Capital Growth (ILLLX) – 2.6% allocation and Very Unattractive rating
[1] Our core earnings are a superior measure of profits, as demonstrated in Core Earnings: New Data & Evidence a paper by professors at Harvard Business School (HBS) & MIT Sloan. The paper empirically shows that our data is superior to “Operating Income After Depreciation” and “Income Before Special Items” from Compustat, owned by S&P Global (SPGI).
Disclosure: David Trainer, Kyle Guske II, and Matt Shuler receive no compensation to write about any specific stock, style, or theme.


