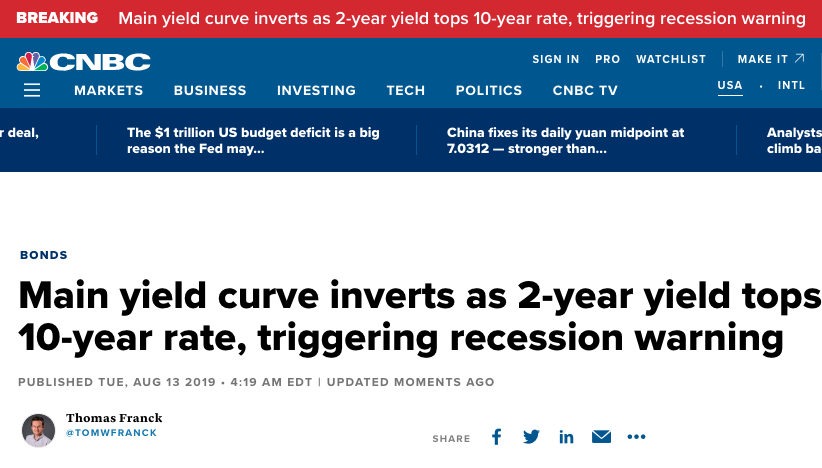
Yield Curve Inversion (2s/10s) Spooks Investors
Equity markets fall, equity markets rise... and round and round we go with trade headlines proving to stimulate and deflate markets with each passing week. On Tuesday, and following a greater than 1% decline in the major averages on Monday, a rally spurred by trade headlines ensued. But we'll get to that in a moment.
For the last few weeks, the S&P 500 (SPX) has been declining under the weight of several headwinds and fear-driven issues:
- Trade war: This is likely the largest fear the market has driven into the psyche of investors/traders. The reason this holds the attention and emotion of many investors is because it has proven to reduce global economic activity. The Trade war issue remains one top and front of mind within investors surveyed by BofAML.
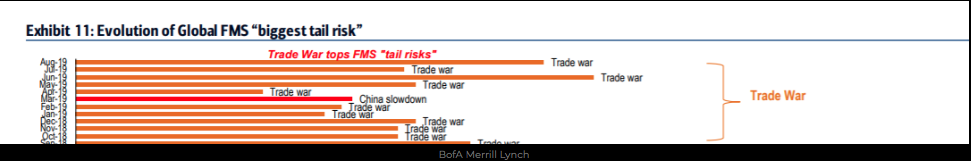
- Everything thereafter the trade war issue seems to originate, as the global economy would prove rather healthy absent the aforementioned trade war that is now more than a year old.
- The strong dollar has proven to weigh on domestic corporate earnings, but by and large, investors look past the forex issues in favor of organic results or ex-foreign exchange issues. Moreover, most corporations have done a reasonable job of hedging forex issues over the years, but it is a cumbersome process and an annoyance.
- China's domestic economy slowing, even prior to the trade war.
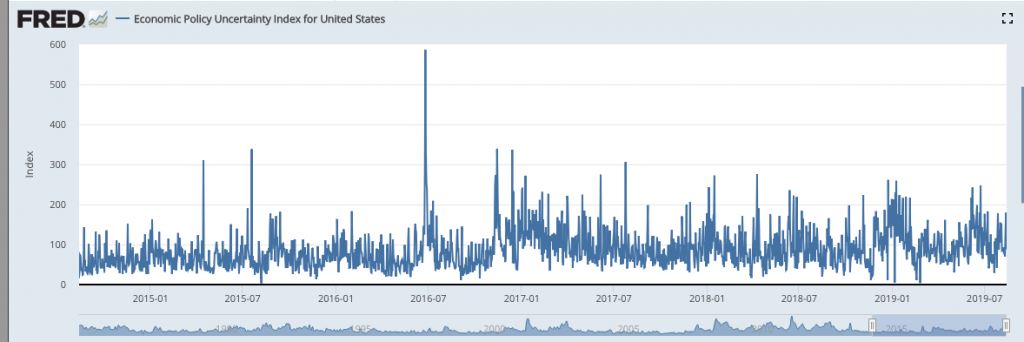
- Economic policy uncertainty that remains elevated under the current White House Administration. It's clear to see that when we look at the period before 2016-present, the index was more docile and remained at much lower levels. (5-yr. chart)
- Hong Kong civil unrest.
- Inverted U.S. Treasury bond yield curve. This last point of concern for market goers is a result of media hype, history and a function of how the credit markets work with respect to lending practices.
With respect to all the concerns noted above, the market has historically climbed these macro and micro-economic walls of worry. One of the reasons the S&P 500 and peer indices are able to perform this feat of strength is largely due to one unfailing principle of the markets: "Markets follow earnings over time." That's it; it is just that simple! While all the issues noted above are relevant and may weigh on the growth of the S&P 500 earnings, as long as those earnings are growing, the market will follow over time. But speaking to the last point of concern on our list above, how focused should we be on the flattening and eventual inversion of the bond yield curve, specifically the 2s/10s bond yields?
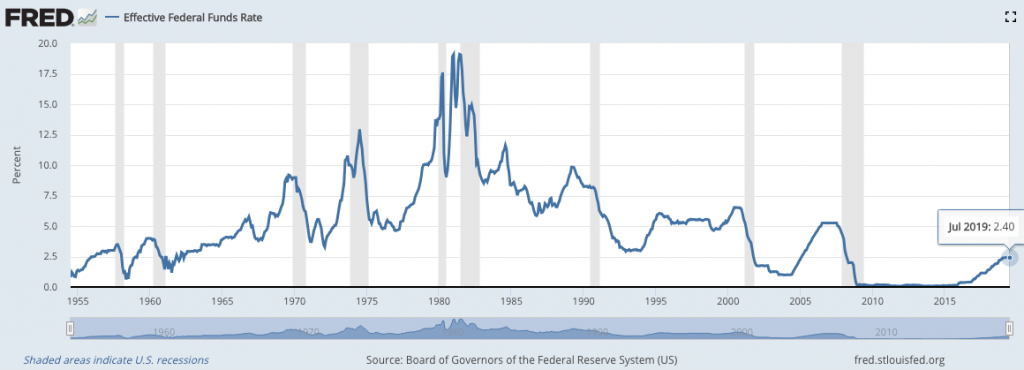
It's important, don't get us wrong. This part of the yield curve is where the shadow banking system picks up where the traditional lenders leave off. To that extent, the real problem isn't the yield curve inverting, it's how long it remains inverted. And to that point, both the 2-year and 10-year yield remain below the Fed Funds Rate (FFR). This forces the Fed to further reduce/ease rates going forward, in part.
Ahead of the market opening on Wednesday, equity futures are already in the red, as the spread between the 2s/10s is less than 1 bps. The curve has been flattening further and since the Fed eased rates in July, not something they likely anticipated as recessionary fears sparked by escalation of the trade feud carried forward. It's very, very likely that the yield curve will indeed invert soon enough. The yield curve has been covered in the press for over 2 years now. When the curve inverts, it is likely to trigger some degree of selling pressure. Algorithms and programmed trading are tuned to such circumstances and keywords generated in media headlines. What matters most is what one does should such selling take place in the equity market. In this case, history may prove a useful guide for investors and traders alike.
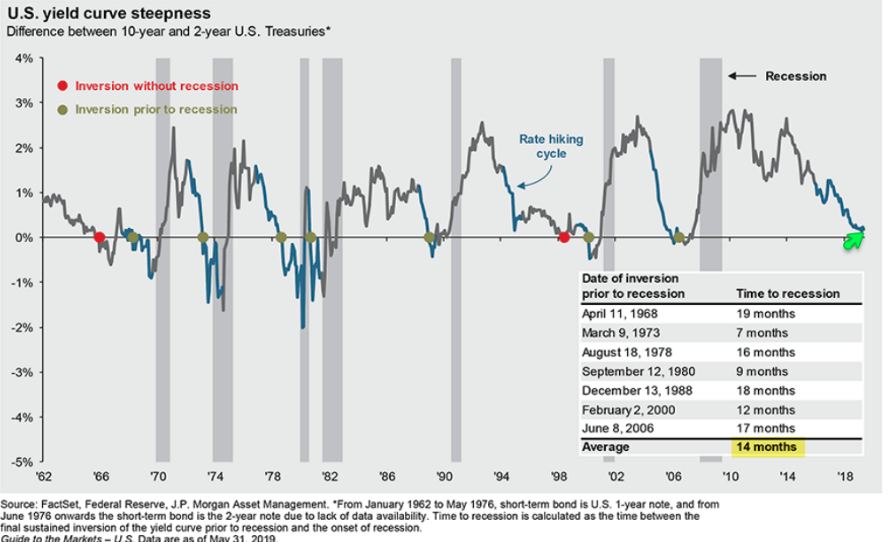
As Finom Group (for who I am employed) has offered in various Research Reports for participating members, the median time frame between a yield curve inversion and recession is roughly 14 months.
Probably of even greater importance to investors is what this means for potential market returns on invested capital. We can use the most recent occurrences for when the yield curve inverted as a guide for what we might expect in the way of market returns. As Chris Ciavacco pointed out recently, market returns after the yield curve inverted in both 1998 and 2005 were quite strong.
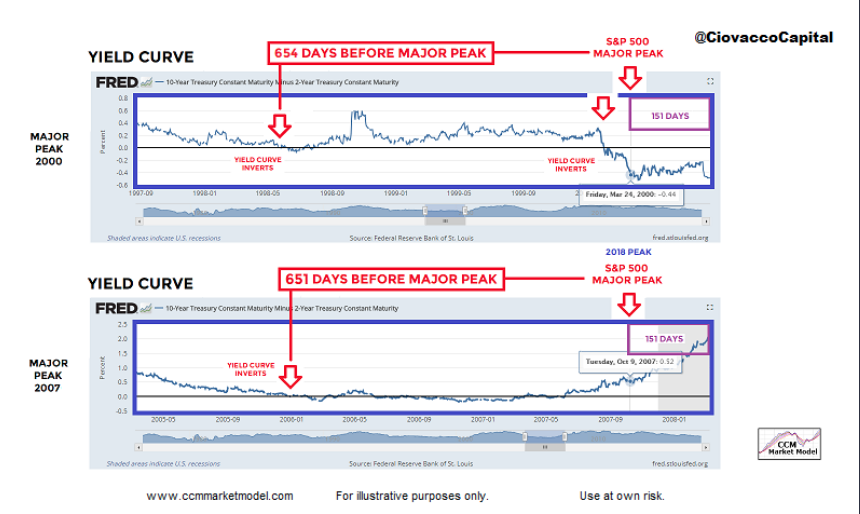
In those two anecdotal cases, the S&P gained over 30% after inversion. After inversion in 1998 and 2005, the average S&P 500 gain was 30.57 percent. The market peaked, on average, 1.8 years after 10-2 inversion. Hypothetically, if the 10-2 inverted today, the S&P 500 would likely peak at 3,763 in May 2021. So while equity futures are pointing to a negative open on Wednesday and with the yield curve about to invert, where is your focus as a trader/investor? Is it on the negative tone from the media about the inversion and 100 point Dow Futures decline, or is it on the historic performance of the market post-yield curve inversions?
One of the things I tend to focus on in the Finom Group Trading Room daily is whether or not the current yield curve inversion couple with market pullback is more concerning. We can evaluate this notion through the credit markets by using the credit markets as an indicator of stress in the markets. The ICE Bank of America U.S. High Yield Master index reading is our most relevant indicator for this issue of concern.
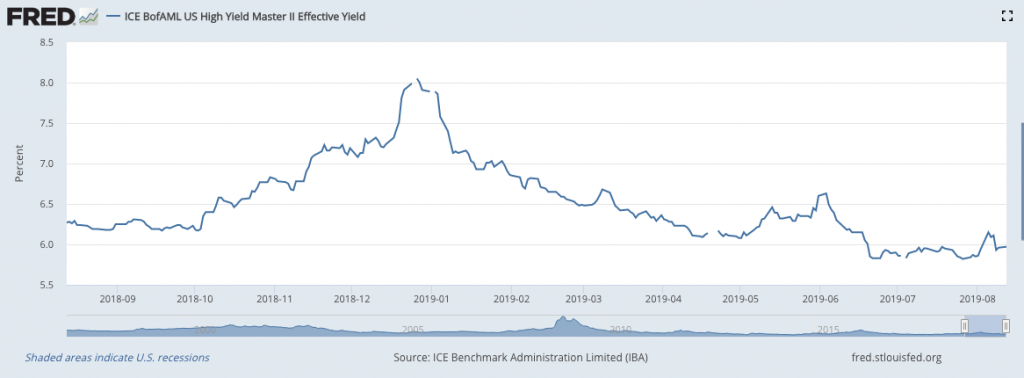
Based on the 1-year index reading, we can see that under the current 6% drawdown in the S&P 500, peak to trough, and with the yield curve extremely flat there is less default risk concerns than in the December 2018 and May 2019 periods. "It's all good", as the kids say and as we might still yet be "whistling past the graveyard", as the adults like to say.
The yield curve issue is not going to go away until it shows clear signs of re-steepening. The media is going to be all over it, daily and especially if it remains inverted, as that would almost certainly find credit spreads widening and stoking equity market fears simultaneously.
One of the things we'll hear a good deal about is the wonderment as to the efficacy of the yield curve inversion as a recession indicator. What's unusual with regards to how this inversion likely takes place is that the 10-year is falling onto the 2-year. An inversion usually happens the other way around with the 2-year rising to invert with the 10-year. So this time, at least in that regards is somewhat different. Moreover, while many will detail reasons as to why the yield curve inversion may not prove to hold the efficacy in heralding a recession as it has in the past, one thing is more certain and that surrounds the resulting lending activity and credit distribution that curtails should the inversion remain. Sometimes, it's not how you get to this point of inversion, it's that there is inversion.
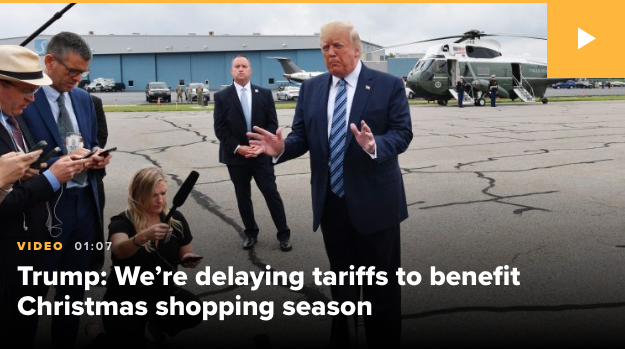
Now for the less sanguine part of this daily show/article, the positive trade headline developments. President Donald Trump, on Tuesday, said he is delaying some tariffs on Chinese imports ahead of the Christmas season to stem their potential impact on holiday shopping. This sent the major indices roaring higher in what could be described as a significant short squeeze.
The Trump administration announced hours earlier that it would delay until Dec. 15 some of the tariffs that were originally scheduled to come into effect Sept. 1.
“We’re doing this for the Christmas season,” Trump told reporters on an airport tarmac around noon Tuesday. “Just in case some of the tariffs would have an impact on U.S. customers.”
“So far they’ve had virtually none,” the president added. “But just in case they might have an impact on people, what we’ve done is we’ve delayed it, so that they won’t be relevant to the Christmas shopping season.”
Here is what Goldman Sachs had to offer with the headlines seemingly coming out of nowhere and after widely anticipating the implementation of tariffs on $300bn in Chinese exports on September 1st.
GOLDMAN: “We believe the decision to delay implementation of tariffs on some goods was driven by concerns over the political risks associated with imposing tariffs on consumer goods before the holiday season as well as the recent deterioration in the US equity market ..”
The market was caught off guard, given the reaction to the headlines. The move to the upside mirrored the move to the downside only two weeks ago when President Donald Trump announced a new round of tariffs to be implemented on September 1st. And you wonder why the economic policy uncertainty remains high, compared to prior White House Administrations? Here is what CNBC's Jim Cramer had to say about the reversal of trade fortunes, at least a reversal for the time being:
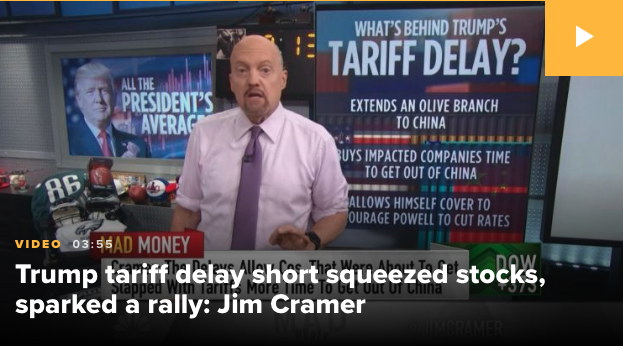
"President Donald Trump’s move to delay a new round of tariffs on some Chinese imports fooled the bears and triggered a short squeeze to spark a market rally.
The next time you’re terrified that everything is falling apart and the stock market’s about to roll over, remember that we have a pro stock market president who’s willing to take action to turn around the averages,” Cramer said. “Maybe that’s unfair to the bears, but it’s fabulous for the bulls.
I think it was a genuine olive branch, something that allows the Chinese government to save face [and] start buying some American ag products,” he said. “They need to buy some pork. They desperately need it because of a particular kind of swine flu that’s proving very difficult to eradicate.”
And as I round out the review of Tuesday's headlines... we have officially inverted the yield curve. Start your clocks folks ;-) Dow Futures are now lower by 165 points in the 6:00 a.m. EST hour.
So what are you to do on a day where the futures are concerned about the yield curve inversion and disregarding the positive trade headlines from Tuesday? Hindsight is always 20/20, but what I'd like to offer is that based on financial conditions remaining relatively loose/easy, the Fed likely to continue to loosen financial conditions further, earnings still growing albeit at a very slow rate, the economy still expressing trend-growth of 1.7-2.5% and both household and corporate balance sheets remaining very healthy due to low rates and a robust labor market... buying the dip in a disciplined manner remains an optimal option, depending on one's personal risk tolerance.
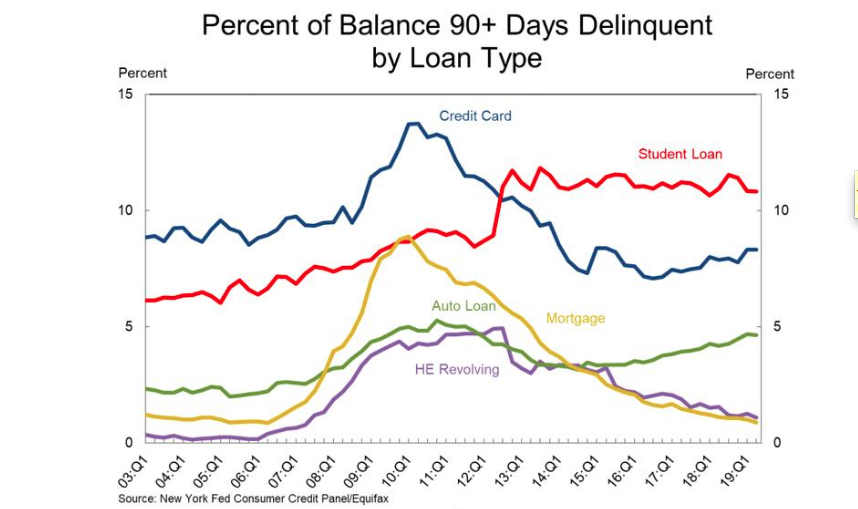
Keep in mind as we muddle through the trading day and with respect to balance sheets and credit conditions, it is hard to have a credit crisis when Mortgage and Home Equity delinquencies keep going down. The recent Q2 2019 Federal Reserve Bank of New York report on Household Debt and Credit outlines that while debt continues to rise, delinquencies continue to decline in the major categories of credit. And for all the hype surrounding student loan debt and defaults that is played up in the election cycle, even this credit category has been flat to lower over the last 6 years, falling in 2019. Outstanding student debt declined slightly, to $1.48 trillion from $1.49 trillion, a typical change in Q2.
But maybe I'm wrong, maybe we shouldn't be considering buying this dip or at least maybe we should express greater caution. This is what Morgan Stanley's Lisa Shalett shared with clients in her notes as follows:
"In particular, I’m concerned that the most recent U.S. escalation of trade and currency-related tensions with China could have more lasting impact on global markets than earlier scuffles. To any investors who are considering buying the dip, I would urge patience for a better opportunity.
I see three areas where the impact from continuing trade tensions has yet to be fully priced into markets, despite the recent downdrafts."
- U.S. growth: Prior U.S. tariffs had limited economic impact due to offsetting currency moves and companies’ ability to fill gaps in their supply chains from other countries. This time, however, the impact of additional tariffs is unlikely to be offset by similar adjustments. That could mean higher prices for consumers or lower margins for corporations in critical sectors which thus far have been spared—including in the auto, electronics and tech sectors where stock valuations remain high. That prospect may further dent corporate confidence and capital investment. Morgan Stanley’s Business Conditions Index has returned to lows from earlier this year, reflecting these risks.
- Currency shifts: The yuan has depreciated slightly against the dollar after the U.S. announced potential new tariffs. While that move might provide a buffer for Chinese manufacturers facing slowing sales, a weaker yuan could also unleash deflationary forces in the global economy as China is the world’s largest trading partner. Already this past week, fears of deflation have prompted global bond yields to fall to all-time lows as other central banks also moved to adopt easier monetary and fiscal policy. Should this dynamic of a stronger U.S. dollar and weaker emerging market currencies become uncontrolled, it could destabilize the global debt market, much of which is denominated in U.S. dollars. Despite recent stabilization, the risk of global markets coming unraveled remains.
- Fed policy: The case for more Fed rate cuts has strengthened, amid slower economic growth and falling global interest rates. But trade dynamics could complicate the efficacy of further rate cuts. Indeed, the Fed could be “pushing on a string,” where lower rates and cheaper credit won’t be enough to boost economic growth. Equally concerning: Additional cuts this year could deplete the Fed’s options if a recession were to develop next year.
"Meantime, the risk of a U.S. recession, while not in our base forecast, is rising. Forward-looking economic indicators are deteriorating, and the inverted yield curve, an important indicator based on bond market dynamics, continues to point to a coming recession. U.S. markets are richly priced, and corporate and consumer confidence, which hold the key to the longevity of the economic cycle, could be poised to fade."
Well, it's not all gloom and doom, granted! But I encourage investors to factor into the decision-making process the recent trade headlines, the upcoming election year impact on economic policy implementation and long-term investing goals. The here and now may prove stomach-churning for sure, but the long-term vision tends to favor market bulls.
A reminder to our readers that market pullbacks are a normal aspect/element within every bull market cycle and shouldn't be viewed from a fearful stance or perspective, but from a perspective of potential opportunity. At Finom Group, I saw this potential opportunity developing through breadth and/or strength divergence roughly a month ago in a report I issued titled, "A Major Breakout Has Occurred in S&P 500." The chart below identified, in part, that the S&P 500 while climbing to new highs in July, was finding its RSI diverging and weakening.
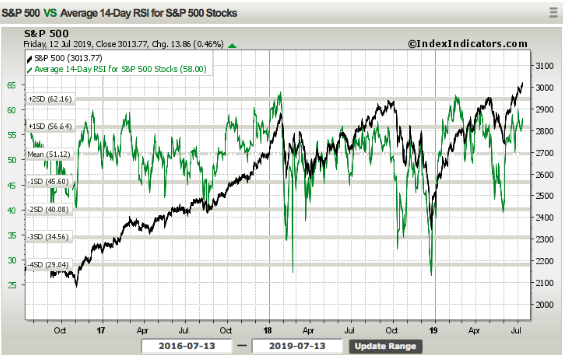
The same divergence occurred leading up to October 2018 and May 2019, both of which occurrences preceded, not caused, future market pullbacks. Coupled with various other points of analysis that can be found in my weekly Research Reports, this lead to me outlining the greater probabilities of a market pullback to take place. But again, I view such pullbacks through the lens of opportunity and not doomsday narratives.
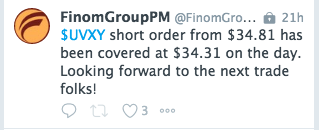
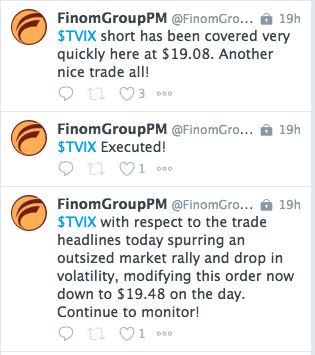
Even with a ramp-up in market volatility, I continue to trade what the market brings. Below are this weeks two trade alerts to-date that I offered.