
Will The Trade Feud Guide Market Performance... Or Something Else Entirely?
The major averages went on a wild ride Monday, kicking off what may prove to be the start of increased market volatility given the headlines surrounding U.S./China trade. President Donald Trump’s Sunday afternoon tweets indicated the probability of increasing tariffs on China this coming Friday from the current 10% level to 25% on an existing $250bn in goods. Investors awakened to a greater than 1.5% gap down in the major averages Monday, but by the closing bell the major averages finished down less than half a percent. Nonetheless, the uncertainty surrounding elevating the trade spat between the world’s two largest economies has spurred the market and awakened investors to the possibility of increased volatility as the “sell in May and go away” seasonal period commenced.
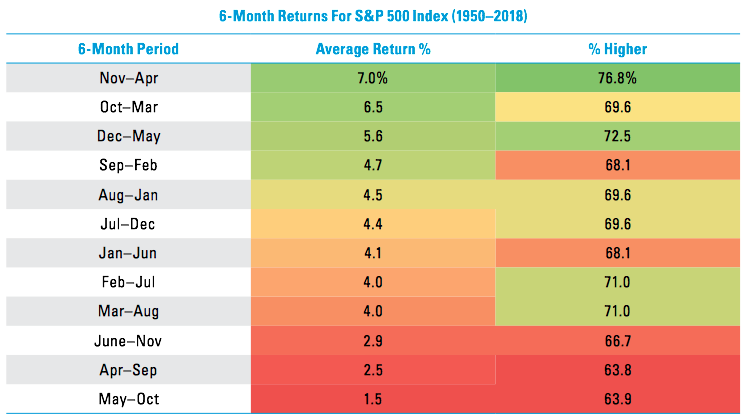
We have certainly entered the historically worst six months of the year for stocks and the geopolitical risks that are seemingly rising may not find the 6-year May performance trend holding in 2019. The S&P 500 has actually closed higher during the month of May six consecutive years. Not to mention these “worst six months” have been higher six of the past seven years. The point is that investors shouldn’t necessarily blindly sell in May, but rather be aware that volatility tends to happen in the summer and fall months. For instance, last year the S&P 500 closed higher in May, June, July, August, and September, and then lost 7% in October for the worst monthly drop in nearly seven years.
Equities have already achieved record highs in 2019 and with the S&P 500 having narrowly missed our 2,950 target just last week. With the benchmark index having risen roughly 17% YTD, it is highly probable that a pullback would present itself to investors. The greatest near-term headwind is obviously related to the trade feud that would certainly given investors cause for concern, as heightened trade tariffs would prove to further disrupt global growth, corporate profits and the demand side of the economic equation further down the line.
Although the equity markets found dip buyers in the late afternoon as China’s trade delegates confirmed their plans to travel to the U.S. to further engage in trade negotiations, equity futures remain under pressure on Tuesday. Headline risk remains front of mind with investors due to the outsized risk to global growth should the White House Administration carry forward with its threats of raising tariffs.
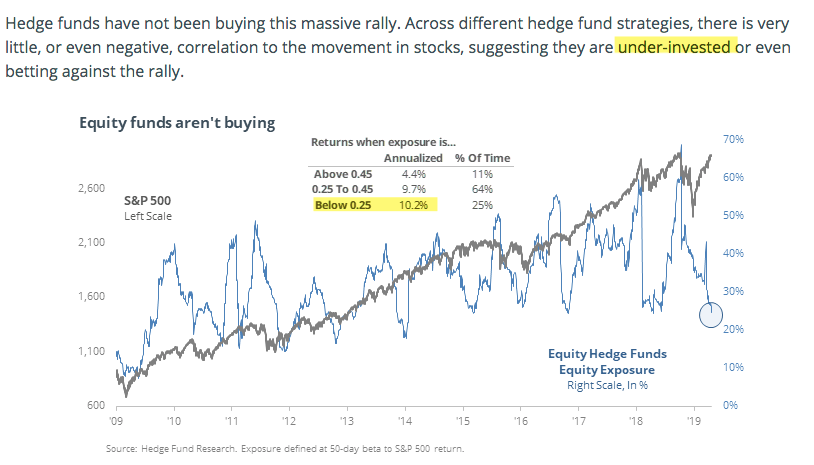
I have previously recognized the limited market exposure for CTAs, hedge funds, and even retail investors as the market has recaptured all that it had lost in Q4 2018 and then some. The lagging appetite for risky assets would seem to be an indication that sophisticated investors are betting against the rally, which has not been the case historically. In fact, the best performance for S&P 500 has occurred in precisely these circumstances, with annualized gains of more than 10 percent. (See chart below)
We often hear the term smart and dumb money when it comes to what is driving market performance. The truth is there is just "money" and those who are making a return on capital investments and those whom aren’t.
While institutional investors and retail investors have had limited appetite for equities in 2019, corporates have picked up where they had left off last year by increasing their YTD buybacks. With this in mind, I aim to understand what investors had been buying and selling during the month of May. We can get a glimpse of this through the latest TD-Ameritrade Investor Movement Index (IMX).
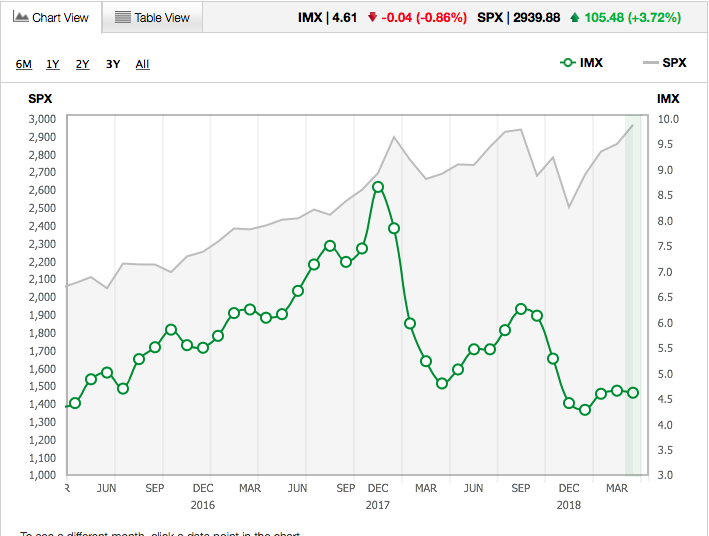
"Exposure to equity markets decreased among TD Ameritrade clients during the April IMX period. The IMX decreased by 0.86%, down 0.04 from the previous period, to 4.61.
TD Ameritrade clients were net buyers overall during the period but favored less risky assets. Clients were net sellers of equities and favored buying of products with reduced risk, including fixed income. This rotation out of equities and into fixed income pushed the IMX to a score of 4.61. Volatility of the S&P 500 was once again light, with only one trading day moving in excess of +/-1% during the period. The Cboe Volatility Index, or VIX, which measures volatility of the S&P 500, spent the period below 15.
Although TD Ameritrade clients were net sellers of equities, they found some names to purchase during the period. With the IPO market in focus, ride-hailing service company Lyft Inc. (LYFT) was a net buy after the stock traded below its IPO price during the period. CVS Health Corp. (CVS) and Walgreens Boots Alliance (WBA) were both net buys as both reached 52-week lows. CVS announced a partnership with Smile Direct but received multiple analyst price cuts. WBA announced it was raising its minimum age to purchase tobacco to 21 in reaction to the FDA's demands for the retailer to do more in curbing underage smoking. Walt Disney Co. (DIS) was net bought after announcing a new streaming service, Disney Plus, and reaching an all-time high. NIO Inc. (NIO) and Tesla Inc. (TSLA) were both net buys again, with both stocks trading lower during the period. NIO was lower after Volkswagen announced increased competition in China, while TSLA missed on earnings and stated it may need to raise additional capital.
Additional popular names bought include Aurora Cannabis Inc. (ACB), Canopy Growth Company (CGC), and AT&T Inc. (T).
TD Ameritrade clients appeared to sell some equities on strength during the period. Facebook Inc. (FB) was up nearly 15% during the period following multiple analyst upgrades and was net sold. Amazon Inc. (AMZN) beat on earnings and announced a move toward one-day shipping for Amazon Prime members, and was net sold after increasing nearly 10% during the period. Big banks Bank of America Corp. (BAC) and Citigroup Inc. (C) were both net sold after each company beat on earnings and moved higher during the period. Twitter Inc. (TWTR) gapped higher during the period to the highest point since last July after the company reported upbeat earnings, and was also net sold. Alibaba Group (BABA) was net sold during the period. Additional names sold include Wabtec Corp. (WAB), Micron Technology Inc. (MU), and General Electric Co. (GE).
While it remains to be seen whether or not investors releverage equity exposure in the future, the fears surrounding trade will likely continue to pervade the market until resolution and/or certainty is discovered. Trade talks will resume on Wednesday, in Washington D.C. Nonetheless, yesterday’s dip buying on ominous trade headlines was actually “par for the course”.
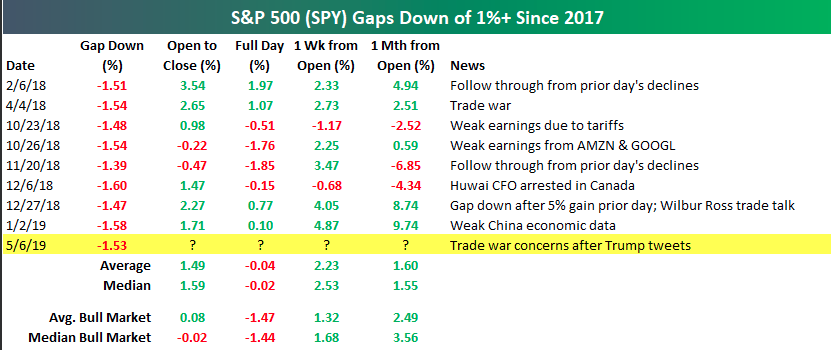
As shown in the trade above from Bespoke Investment Group, there tends to be heaving dip buying on these trade headlines, intraday. Having said that, the fear surrounding the impact of elevating tariffs remains a real and growing concern as the impact on the global economy has been measured to adversely affect growth. Nancy Lazar of Cornerstone Macro highlights that U.S. and China GDP could both be negatively impacted by ~0.2% if existing tariffs are increased to 25 percent.
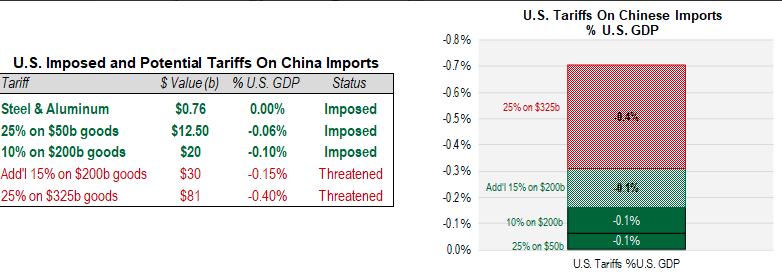
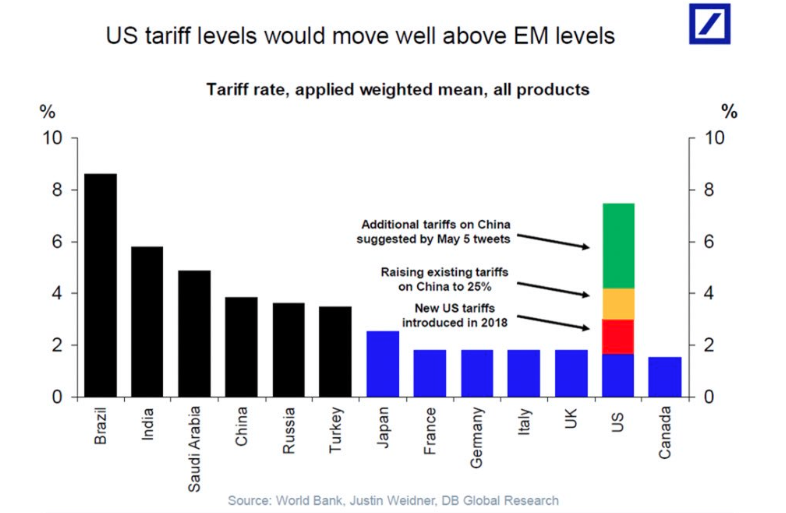
Moreover, if the U.S. follows through on the latest trade war threats it will raise the overall U.S. tariff level to 7.5%, which is higher than in many emerging markets, according to Deutsche Bank.
In short, there’s nothing positive to glean from raising tariffs in terms of economic growth and business sentiment. But even so, Oppenheimer offers the following with regards to any near-term market weakness.
"We expect that any near-term downside moves by the equity markets could be quick to reverse, ... We suggest that investors consult their shopping lists for stocks that might have “gotten away” from them in the recent rally.”
In discussing the subject matter surrounding the latest trade feud developments, here is what CNBC Mad Money host Jim Cramer has to say:
“At the end of the day, the People’s Republic needs our commerce a lot more than we need their commerce,” the “Mad Money” host said. “The United States is a cash-fueled economy, the PRC is a debt-laden house of cards. They need our money, but do we really need their cheap stuff?”
When the averages got hit this morning on new Chinese worries, people almost instantly pulled out their shopping lists and started buying high-quality domestic stocks that have nothing to do with the trade war. That’s a very bullish sign.”
As investors await the market’s open on Wall Street Tuesday, equity futures have worsened with Dow futures down greater than 120 points in the 6:00 a.m. hour. Having said that, we turn our attention to investor sentiment. In this weekend’s research report, Finom Group (for whom I am employed) discussed investor sentiment having turned more positive in the most recent reading of the AAII survey.
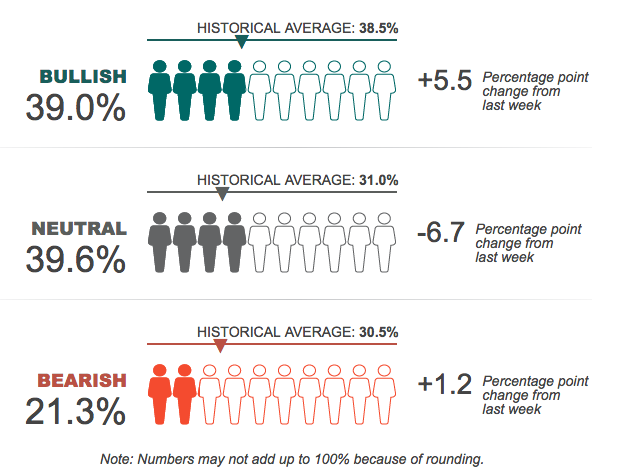
“The latest AAII survey shows that Bullish sentiment has improved, but it is only slightly above the historical average and the Neutral sentiment is very much above its historical average. Having said that, bearish sentiment is extremely low, which may prove a contrarian indicator. But the market always needs a spark to change sentiment. That’s what investors have to always be considering when actively trading and/or managing their portfolio; what could spark a deeper market pullback?”
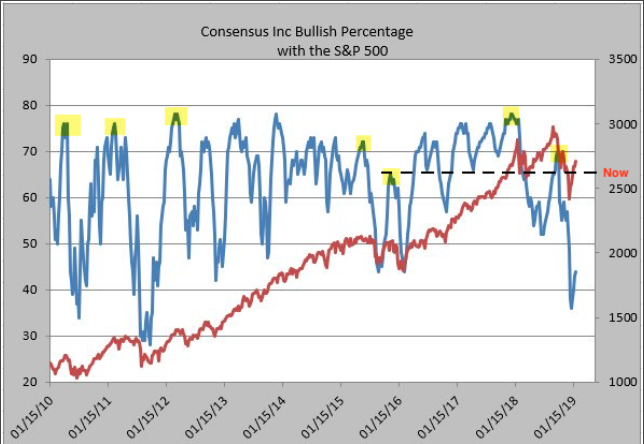
It’s clear that the extremely low level of bearish sentiment may indeed be the contrarian indicator that we suggested and the spark for a greater market pullback may have been introduced via the escalation of the trade feud between the U.S. and China. Time will tell! Additionally, sentiment amongst analysts finally climbed back to 66% last week. That marked the high in late-2015. But bulls exceeded 70% before peaks last September and in mid-2015, and bulls exceeded 75% before peaks in 2010, 2011, 2012 and in January 2018. As shown in the chart below, analysts’ sentiment is increasingly bullish, but not at extreme levels. Contrarian indicator?
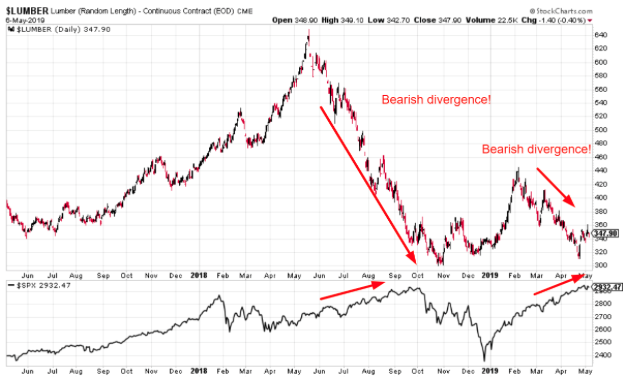
One of the more bearish narratives on the market recently came via Michael Gayed of Pension Partners and through the lens of Lumber prices. Gayed suggests that Lumber is a leading indicator of economic conditions. Finom Group clarified the misnomer offered by Gayed in its recent State of the Markets video here.
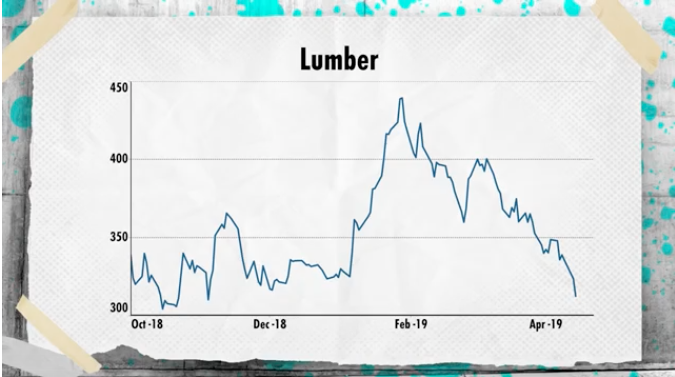
Gayed forcibly omits the impact from tariffs implemented in 2018 and on Lumber prices, which even now are at 5-year highs after having fallen through the Q4 2018 period. But in the interest of supporting a fact-driven analysis, I looked for a 3rd party to weigh in on this so-called bearish indicator for the market and economy. A recent study by Troy Bombardia shed some light on the subject of Lumber as a leading indicator of bearish things to come in the market and/or economy. Remember, while the economy and market may diverge intermittently, they trend together over time.
So here’s what happens next to the S&P when it rallies more than 5% over the past 60 days while Lumber falls more than -20 percent.
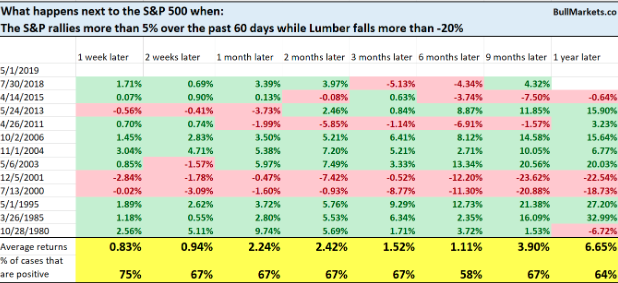
As shown in the table above, the market is higher more than 50% of the time across all time frames. So much for Lumber prices being an indicator of market bearishness. If the market should weaken near-term, it won’t be due to what Lumber prices indicate, it will be due to a confluence of factors affecting investor risk appetite that range from the geopolitical to the outlook on corporate profits. Lumber prices have very little to do with anything. Furthermore, the divergence in the price of Lumber vs. housing data doesn’t even suggest weakening in the overall housing market through the first half of 2019.
In terms of looking more closely at the economy through the lens of economic data points, there’s not a whole lot of data due out this week. Overseas, German manufacturing orders picked up slightly in March, but not enough to compensate February's steep fall and held by weak domestic demand for capital goods, data from the Federal Statistical Office showed Tuesday. Total orders for the key sector rose 0.6% month-on-month, whereas economists polled by The Wall Street Journal last week had expected a 1.2% rise. On a year-on-year basis, factory orders fell 6 percent in March after an 8.1 percent decrease in February. Economists were looking for a 5.4 percent slump.
"The slight order increase in March is not least due to bulk orders," the German economics ministry said. Stripping out volatile demand for big-ticket items, manufacturing orders would have registered another monthly decline, the ministry added.
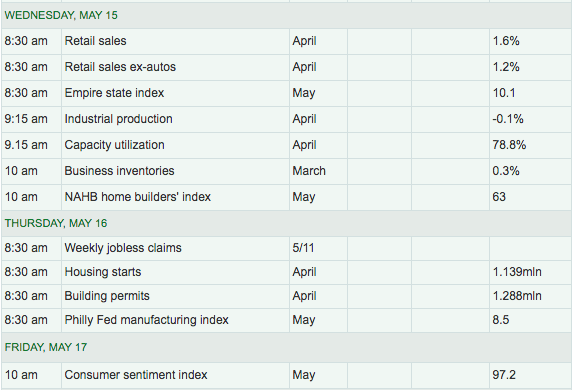
Stateside, investors will receive the latest results from the JOLT Survey that stood at 7.1mm as of March 2019. The survey is anticipated to dip further from recent highs of 7.55mm, but still indicate strong labor market conditions. It’s not until next week that more critical economic data points are delivered in the way of home and retail sales as indicated in the table below:
Investors may look past a great many sentiment and historical statistics in the near-term as headline risks loom large. I would encourage investors to consider the big picture, the forest for the trees so to speak. With the S&P 500 having risen some 17% for the year already, the risk/reward has now slanted more bearish over the interim. Earnings will likely prove to have grown for the Q1 period and the economy is likely to resume trend-growth pace in 2019; much of this has been priced into the market. From that perspective, future quarterly economic growth will be the focus and brought into greater consideration given the geopolitical risks that include both trade and the potential for conflict between the U.S. and Iran. As such, a more neutral stance on market exposure is encouraged by limiting risk exposure and formulating a shopping list of equities and/or index ETFs to acquire in the event improved valuations are found over the next couple of months. It’s often difficult for active traders and portfolio managers to consider the next couple of months and forgoing daily activity, but it often proves a rewarded practice and discipline.


