
Will The ECB Deliver The Fuel For New All-Times Highs In The DAX30 CFD?
This week's market outlook will provide insights for DAX30 CFD, the US Dollar, the Euro, the Pound and Gold.
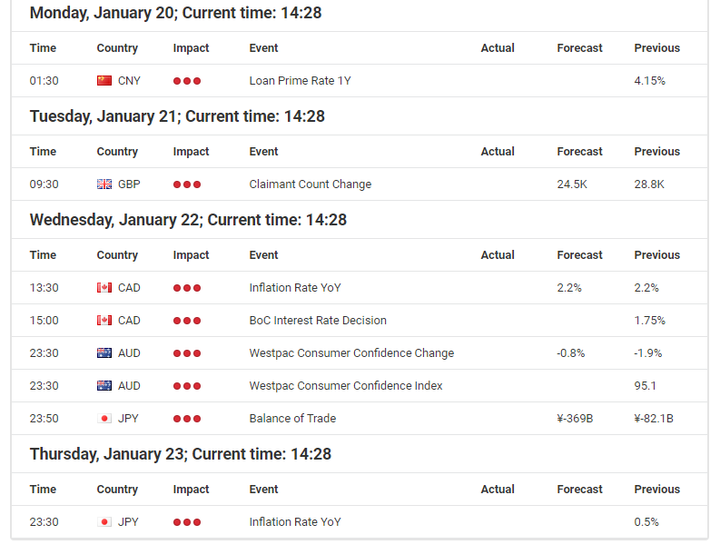
Source: Economic Events Calendar 20 January – 24 January 2020 - Admiral Markets' Forex Calendar
DAX30 CFD
After the short push below 13,000 points in the DAX30 CFD, resulting out of rising geopolitical tensions between the US and Iran, the German index hasn't seen a push back up to its all-time high around 13,600 points.
But in our opinion the picture stays very positive, and a push higher in the days to come is a serious option.
With the sign-off of the Phase 1 trade deal between the US and China last Wednesday, and the FED continuing to flood markets with liquidity to avoid a funding crisis, the downside should be limited as long as the German index trades above 12,900 points.
But with the ECB rate decision on Thursday, and new speculations around fiscal stimulus (especially from Germany) making rounds, a push up and above 13,600 points to a new all-time high is a serious option.
In regards to a potential fiscal stimulus from Germany, it is noteworthy that one main reason for publishing the slowest economic growth in six years in 2019 is because the German government opted for a consistent surplus on its budget, last having a budget deficit in 2011.
With that in mind, the ECB building pressure here to see her monetary stimulus bearing fruits should be taken into account, and hints at the press conference with Christine Lagarde should be carefully watched in regards to their impact on equities.
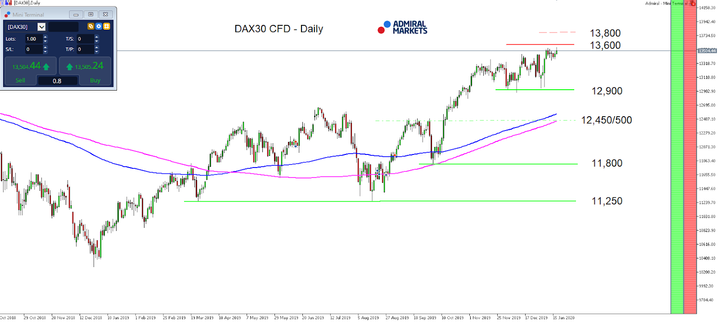
Source: Admiral Markets MT5 with MT5SE Add-on DAX30 CFD Daily chart (between 05 October 2018 to 17 January 2020). Accessed: 17 January 2020 at 10:00 PM GMT
Please note: Past performance is not a reliable indicator of future results, or future performance.
In 2015, the value of the DAX30 CFD increased by 9.56%, in 2016 it increased by 6.87%, in 2017 it increased by 12.51%, in 2018 it fell by 18.26%, in 2019 it increased by 26.44% meaning that after five years, it was up by 34.2%.
Check out Admiral Markets' most competitive conditions on the DAX30 CFD and start trading on the DAX30 CFD with a low 0.8 point spread offering during the main Xetra trading hours!
US dollar
The picture for the US dollar is nearly the same as it was two weeks ago. That said, it also means that our mid-term USD scepticism remains.
Technically, the bullish picture stays intact as long as the USD Index Future stays above 95.00 points on a weekly time frame, this region is likely to be in our focus in the days to come.
A break lower makes a quick drop lower down to 93.00 points likely and switch the mode on a weekly time-frame to bearish from the beginning of October 2019 with an established sequence of falling highs and lows.
On the other hand, only recapturing 98.50 brightens the technical picture, but without 10-year US Treasury yields recapturing 2% (which seems very unlikely given the expectation of the FED to keep flooding markets with liquidity to avoid a funding crisis) the advantage in the US dollar is potentially being found on the short-side.
Nevertheless, with US inflation coming in at 2.3% year-on-year in December 2019, at the highest level since October 2018, the easing potential for the FED seems to be limited, reducing the current downside potential in the Greenback.
Only if the expectations of market participants of at least one 25 basis point cut in 2020 keep on increasing above 70% (currently we see a likelihood of ~60%), further bearish momentum in the US dollar finds a potential driver.
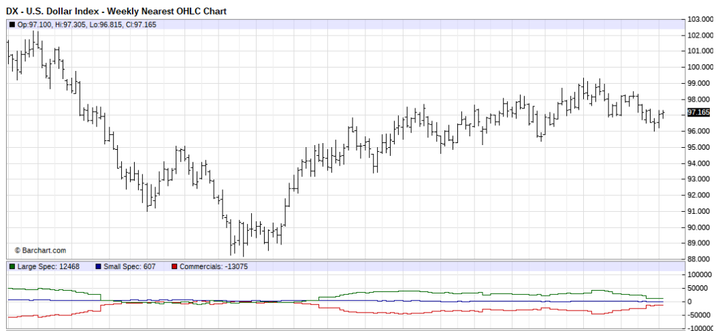
Source: Barchart - U.S Dollar Index - Weekly Nearest OHLC Chart (between January 2017 to January 2020). Accessed: 17 January 2020 at 10:00 PM GMT
Don't forget to register for the weekly Trading Spotlight webinar with presenters including Jens Klatt, every Monday, Wednesday and Friday at 2pm London time! It's your opportunity to follow Jens and others as they explore the weekly market outlook in detail, so don't miss out!
Euro
Over the last week of trading, Euro traders needed a lot of coffee to stay away at their trading desks. Volatility was very low, with the EURUSD seeing a weekly trading range of around 70 pips.
That said, the picture in the Euro hasn't changed over the last week of trading at all and the main focus switches now to the ECB rate decision on January 23.
In this regard, we'd like to point out again our bullish take for EURUSD, technically as long as we trade above 1.1050/70 on a daily time frame.
While the currency pair couldn't make it back above 1.1200, we still like to point out the solid Euro performance despite 10-year US Treasury yields keeping on stabilising and the still positive yield differential between US and European bonds.
One potential reason could be that market participants/Euro traders still see an elevated likelihood of fiscal stimulus, especially from Germany and the ECB with ECB president Lagarde delivering new hints about talks between the ECB and countries who have the room to deliver such fiscal stimulus.
In regards to Germany, it is certainly true that one main reason for publishing the slowest economic growth in six years in 2019 is because the German government opted for a consistent surplus on its budget (it's last budget deficit was in 2011).
That said, we continue to see a first target in EURUSD around 1.1400 in the weeks to come, as long as we trade above 1.1000.
On the other hand, we need to remember the CNBC interview with White House advisor Navarro who mentioned that the US is "going to try to get something going [in regards to a trade deal] with Great Britain, Vietnam, Europe and anybody else who wants to fairly trade with the United States of America", making especially Europe a potential target for a tariff announcement from US president Trump after the Phase 1 trade deal with China was signed last week on Wednesday.
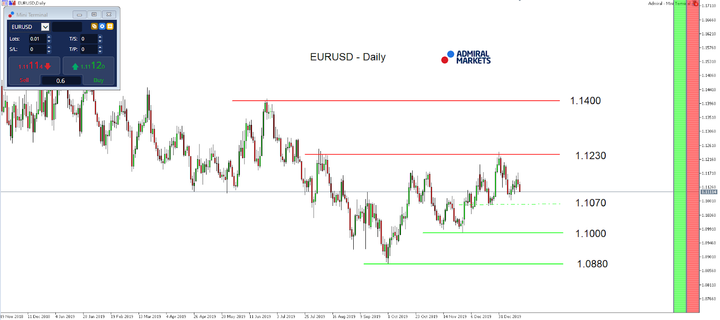
Source: Admiral Markets MT5 with MT5SE Add-on EURUSD Daily chart (between 19 November 2018 to 17 January 2020). Accessed: 17 January 2020 at 10:00 PM GMT
Please note: Past performance is not a reliable indicator of future results, or future performance.
In 2015, the value of the EURUSD fell by 10.2%, in 2016 it fell by 3.2%, in 2017 it increased by 13.92%, 2018 it fell by 4.4%, 2019 it fell by 2.2%, meaning that after five years, it was down by 7.3%.
JPY
The Japanese Yen has continued to refuse any signs of strengths over the last week again. In fact, the USDJPY saw a push up and above 110.00, letting the currency pair trade at its highest level since May 2019.
While we still remain bearish for the USDJPY in the midterm, especially due to the fact that the FED keeps flooding markets with billions in liquidity to avoid a funding crisis, and market participants are expecting at least one 25 basis point cut in 2020, resulting in limited upside potential for the USDJPY, we also have to admit that current market conditions are not very favourable for the JPY.
With US inflation coming in at 2.3% year-on-year in December 2019 at the highest level since October 2018, the easing potential for the FED seems limited, leaving only a broad risk-off as a potential driver lower in USDJPY on the table.
And here, the sign-off of the Phase 1 trade deal between the US and China last Wednesday with chances seemingly good that no near-term tensions between the two countries arise, market conditions should see low volatility and thus unfavourable conditions the JPY.
That said, a sustainable push above 110.00, activating 110.70 is very likely, especially as long as USDJPY keeps on trading above 109.50.
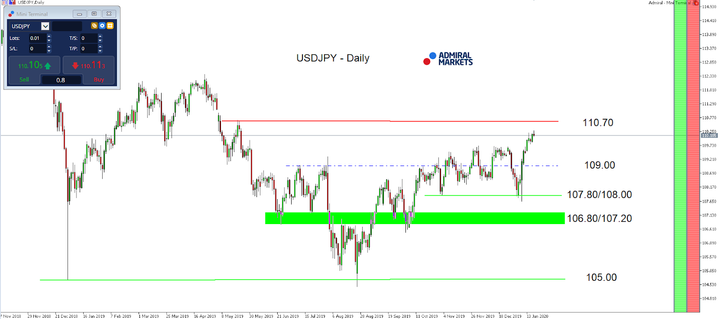
Source: Admiral Markets MT5 with MT5SE Add-on USDJPY Daily chart (between 07 November 2018 to 17 January 2020). Accessed: 17 January 2020 at 10:00 PM GMT
In 2015, the value of USDJPY increased by 0.5%, in 2016 it fell by 2.8%, in 2017 it fell by 3.6%, in 2018 it fell by 2.7%, in 2019 it fell by 0.85%, meaning that after five years, it was down by 9.2%.
Gold
As we pointed out in last week's market outlook, chances seemed good that the precious metal would stabilise around the yearly highs of 1,550 USD over the course of last week.
And indeed, Gold did exactly that, leaving us to come to the conclusion that the overall picture hasn't significantly changed for the days to come.
With US inflation coming in at 2.3% year-on-year in December 2019, at the highest level since October, and with 10-year US Treasury yields stabilising below 2%, the outlook for Gold stays positive.
This is true, despite the sign-off of the Phase 1 trade deal between the US and China, with chances seemingly good that no near-term tensions between the two countries arise and thus market conditions don't seem very favourable for Gold.
But from a seasonal perspective, Gold still finds itself in a favourable, bullish environment. After Silver, which is highly positively correlated to Gold, entered a bullish seasonal window last week on Monday, Gold enters one between the January 24 and February 4.
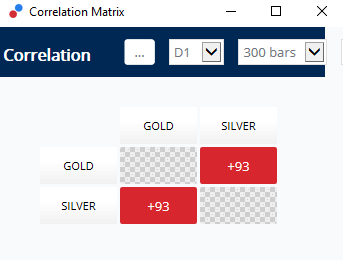
Source: Admiral Markets MTSE Correlation Matrix
The seasonal bullish pattern developed over the last 20 years with Gold seeing an average gain of 23.50 USD for 15 of the past 20 years.
In the remaining five years, it dropped on average only 11.73 USD, while the maximum loss of the pattern was 23.90 USD and the maximum drawdown being 26.05 USD.
Technically, Gold stays bullish on a daily time-frame as long as we trade above 1,440/450 USD and the potential next target on the upside being found in the region around 1,650/700 USD.
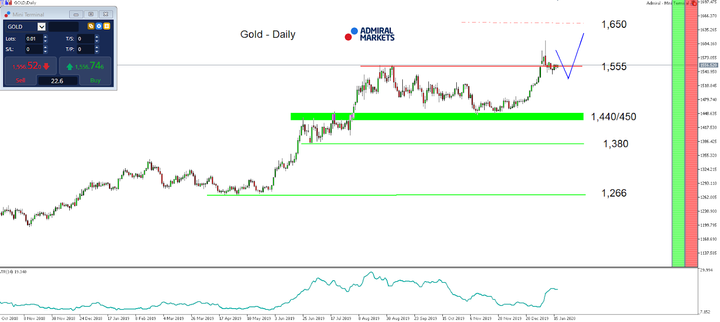
Source: Admiral Markets MT5 with MT5SE Add-on Gold Daily chart (between 17 October 2018 to 17 January 2020). Accessed: 17 January 2020 at 10:00 PM GMT
Disclaimer: The given data provides additional information regarding all analysis, estimates, prognosis, forecasts or other similar assessments or information (hereinafter "Analysis") ...
more

