Will The Confluence Of Technicals Get & Hold S&P Over 3,000... Soon?
Entering the trading week, we were of the opinion that the rally in the major averages from the previous week would find a continuation of that rally. In looking at market breadth/internals, as well as what was expected to be a favorable financial sector reporting season, we offered the following in last week's Research Report:
Based on history, it would appear as though the probability for the S&P 500 to have another positive week is remarkably strong. And don’t forget the seasonal patterns that we recently outlined from this week’s State of the Market video. While the “Sell in May and go away” period is coming to an end, the “Buy the October Dip” is in play."
All Things S&P 500
For the week, the S&P 500 (SPX) finished higher by roughly half a percent. It wasn't a gangbuster week for the major averages, especially with the Dow Jones Industrial Average (DJI) losing all of its weekly gains in the final trading day of the week, and to finish lower on the week by .17 percent. It's important to keep in mind that the DJIA 256-point drop on Friday was largely the result of just two stocks making headlines, and not the good kind. Boeing (BA) and Johnson & Johnson (JNJ) on Friday together accounted for 227 points out of the DJIA's 256-point drop.
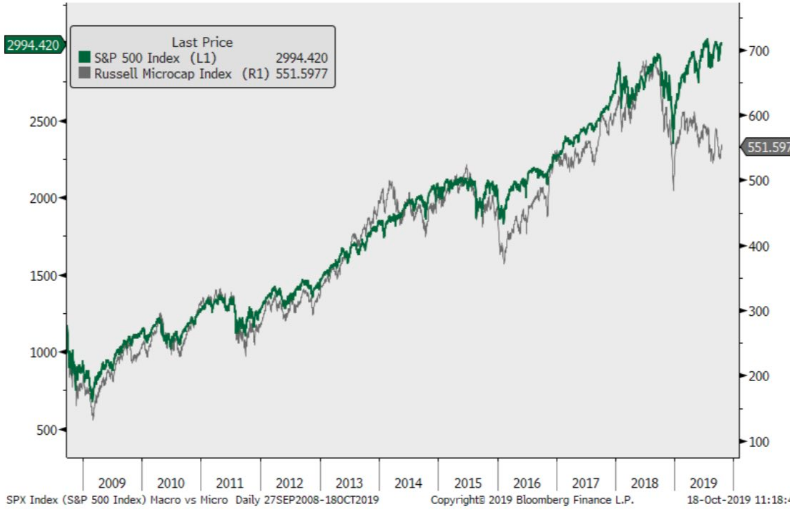
The best performing index for the week was the Russell 2000 (RUT), which gained more than 1.5% for the trading week, bridging the gap between small caps and large caps. A lot has been made about the small caps lagging, but I remains of the opinion that small caps will bridge the gap higher rather than find a sustainable downtrend in the S&P 500 or their respective index ETFs. The chart below actually identifies and validates my outlook for the respective index's and index ETFs.
Lately, it has been made clear that market seasonal trends loom large and are undeniable, but are they going to be repeated is the question we ask ourselves as investors. The many S&P 500 charts and market internals that we study suggests that pivots can and are likely to continue. Having said that, the S&P 500 has successfully put in a chart formation that shows successive higher lows. This is typically a bullish longer-term pattern that I like to see.
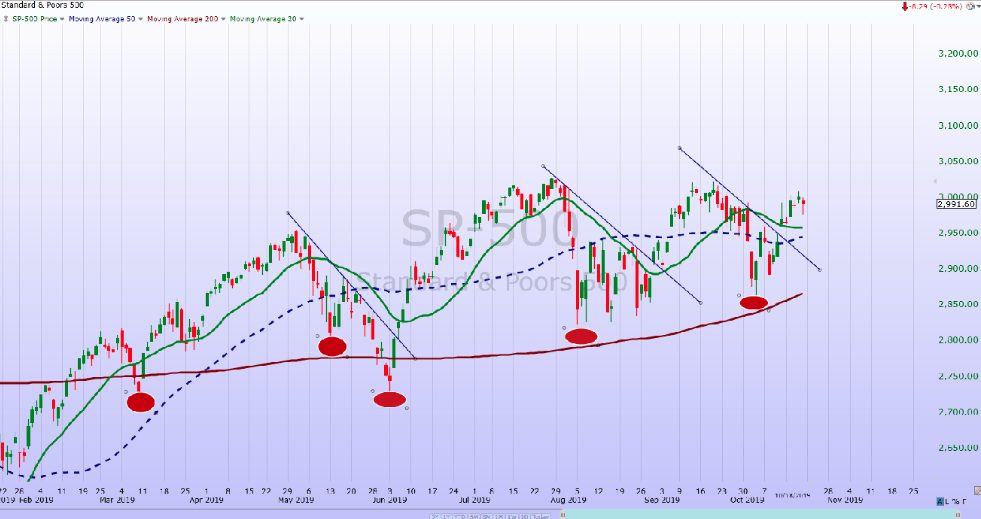
The June low was 2,730, August low 2,822, October low 2,855. The index now resides above the 20, 50, and 200-DMA to boot!
With 2-consecutive positive weeks for the S&P 500, I would expect to have seen the number of stocks within the S&P 500 trading above their 200-DMA on the rise. That is exactly what we witnessed this past trading week, indicating market internals continued to improve...
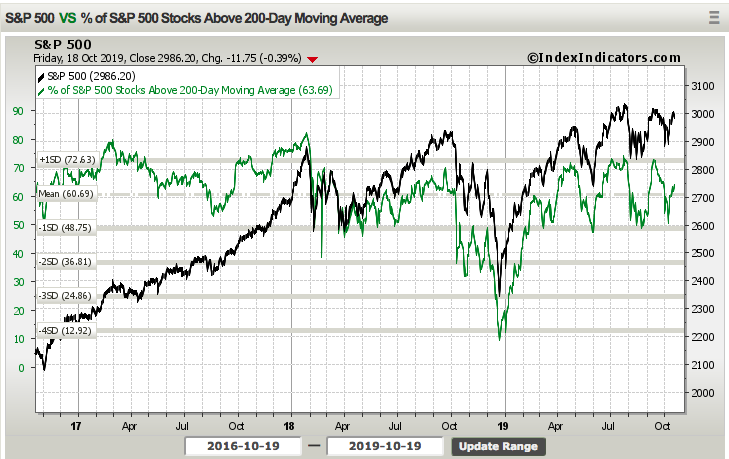
Recall from prior reporting, the number of S&P 500 stocks trading above the 200-DMA was just below 60 percent. Since then, the percentage has increased to just over 63 percent. While this is a longer-term bullish reading of market internals, when we look at the S&P 500 index ETF (SPY), that's where things get a little dicey.
The S&P 500 has been threatening to achieve new highs. But each time it gets close or even slightly above the 3,000 level, that's where things seem to break down. In the middle of the week, when we took a closer look at SPY, we could see that when the S&P 500 got to that 3,000 level, SPY Momentum was actually threatening new relative lows. No bueno!
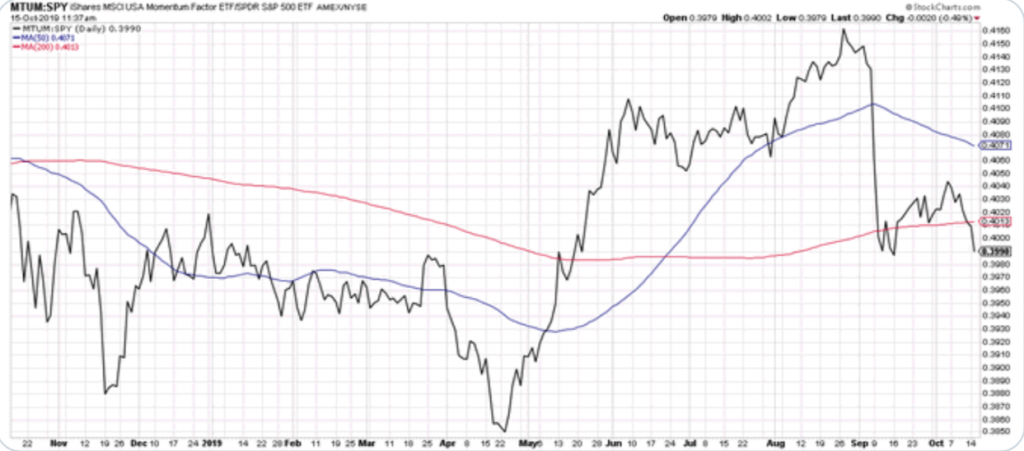
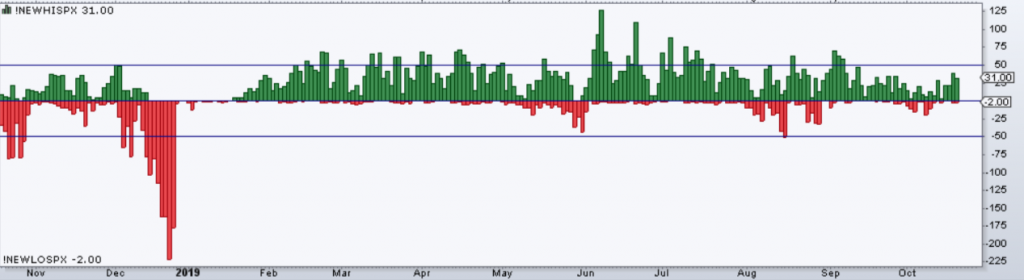
The black line in the MTUM:SPY chart above is the Momentum tracker, which as we can see found it's lowest level since May 2019. Is this a bearish signal? No! But bullish it is not either. Depending on what chart and/or breadth indicator we look at, truth be told we can make the case for it being bullish or bearish. That's actually the calling-card of a sideways market that has been consolidating for an extended period. Another way we can hypothesize market internals is through the S&P 500 new highs and lows index.
The S&P 500 new highs exceeded 100 in June, but have not exceeded 50 since September 5th. We shouldn't expect the same achievement so soon, especially with fewer stocks left to achieve such a feat. Nonetheless, market leadership is clearly lacking presently. The good news, however, new lows are even weaker than new highs, so the bulls still have the edge with this indicator and new highs have recently spiked (New highs green, new lows red).
Speaking of market leadership, we usually look toward tech and/or FAANG stocks. Unfortunately, FAANG hasn't provided any leadership over the last 90 days. With respect to each FAANG stock, last week didn't end well for the group and especially after Netflix (NFLX) released results that were largely better than expected, but left uncertainty surrounding U.S. subscriber growth going forward. (Charts below from Bespoke Investment Group)
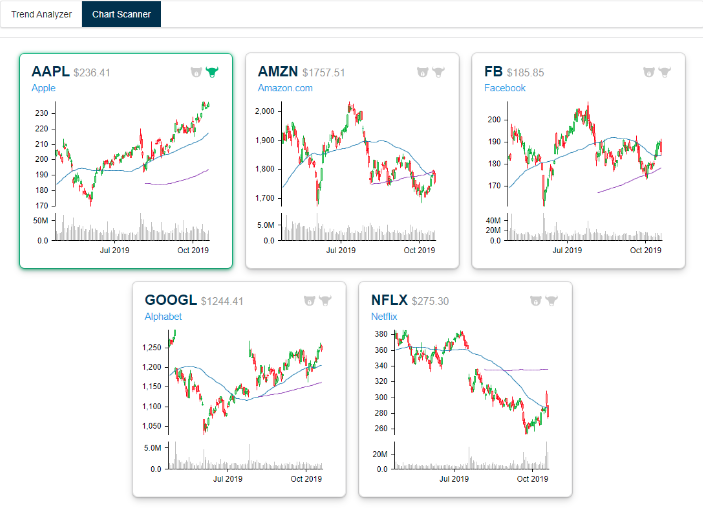
As shown in the stock charts above for each FAANG stock, only Apple Inc. (AAPL) finished with a green candle. Tech and FAANG stocks are going to come into focus over the next 2 weeks with Microsoft (MSFT), eBay (EBAY), Twitter (TWTR) and Amazon (AMZN) all set to report quarterly results this coming week.
The S&P 500 will be riding a 2-week winning streak heading into the coming week and with the benchmark index above all key moving averages. Having said that, the tail-end of the week found the S&P 500 losing momentum and with 2 consecutive down days. The S&P 500 14-day RSI has had 2 trading weeks in October to recapture greater strength and it has, but only modestly and with the market heading into what is typically the best seasonal period for stocks.
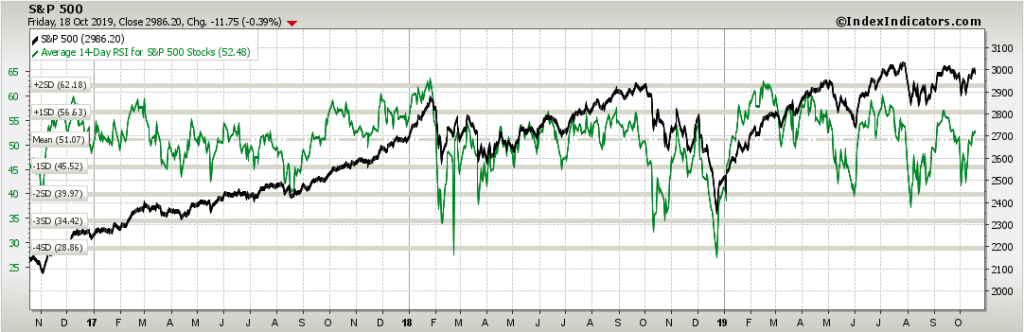
As shown in the chart above, the 14-Day RSI seems to have stalled out at 52 and shy of previous RSI highs for the year. Additionally, it seems to be making lower highs since June. This may simply mean that the market demands another catalyst and that catalyst may be provided by way of tech earnings. The all-time highs could be tested with about 120 S&P 500 companies are scheduled to release their quarterly results in the week ahead.
“You’ve got the potential for a combination of things that drive us to new highs,” said Art Hogan, chief market strategist at National Securities. “At the same time you’re getting better micro data in the earnings, you’re getting better news on the macro hurdles facing us.”
The coming week could be a tricky one! Both Boeing and Caterpillar (CAT) are set to report alongside the previously mentioned companies. These mega-cap names aren't likely to offer a good deal of positive commentary based on the evidence presented from a global slowdown. The chart of CAT alone gives investors enough "cause-to-pause", as shown below:
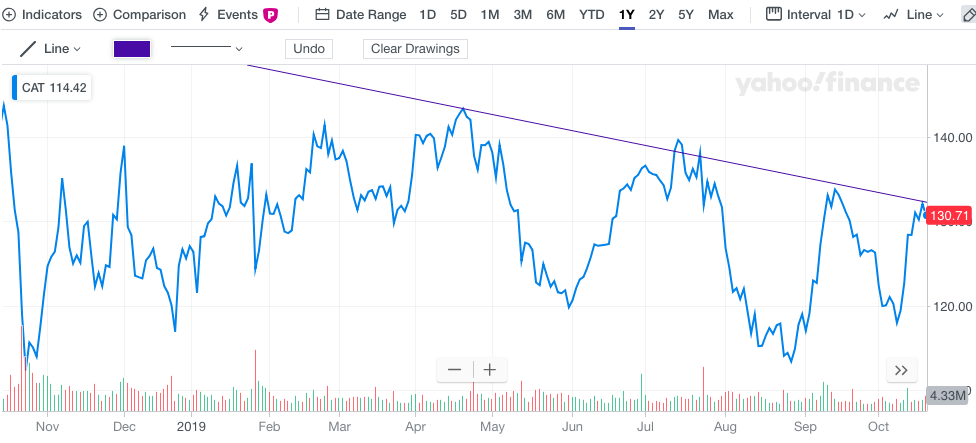
Shares of CAT has seen successive lower highs since May. Shares are right back to the upper trend line and depending on the results and investors' reaction to said results, the Dow will likely follow. There is definitely opportunity shown in the chart here for a breakout, but until it happens, cautiously optimistic is the name of the game near-term.
With optimism fading as the trading week carried forward, investors become that much more nervous as a Brexit vote was set to take place on Saturday. We can see this nervousness play out in the equity put/call volume.
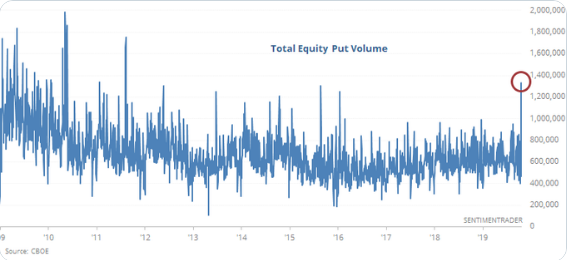
According to Sentiment Trader, Friday saw the highest equity put volume since August 2011. As a percentage of NYSE volume, it was the highest since February 2009. In addition to the put volume noted, this is why we see the equity put/call ratio rising in a week where the S&P 500 also rose.
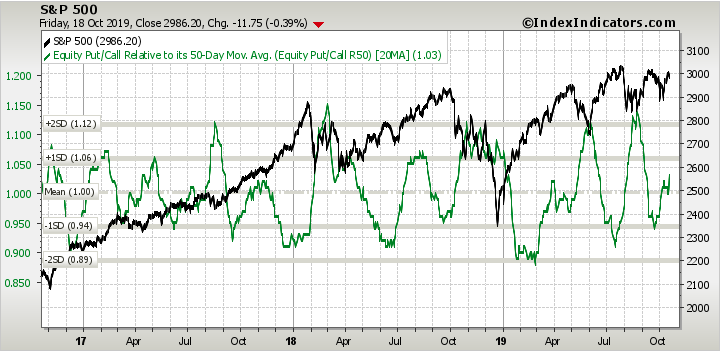
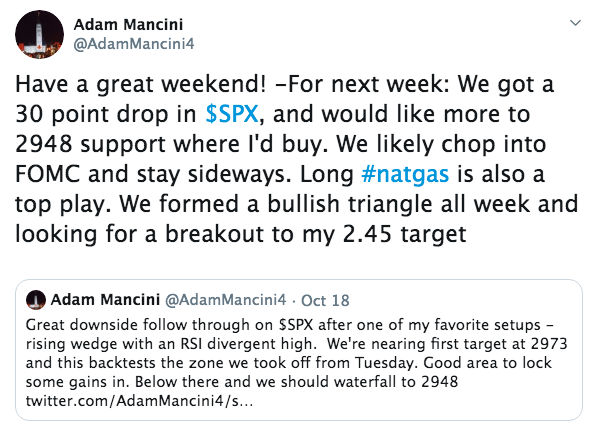
Now, this is why I'm just a touch nervous going into the coming trading week. I usually don't like to see the S&P 500 rising and the equity put/call ratio rising together, as it might signal a near-term downturn in the benchmark index. It's probably safe to say that we shouldn't be surprised to witness the S&P 500 check-back lower in the coming week at some point, based on the Equity put/call ratio. How big of a pullback, if any, remains in question. According to Adam Mancini, a fan-favorite on #Fintwit, a 30-point S&P 500 drop is in the cards this coming week.
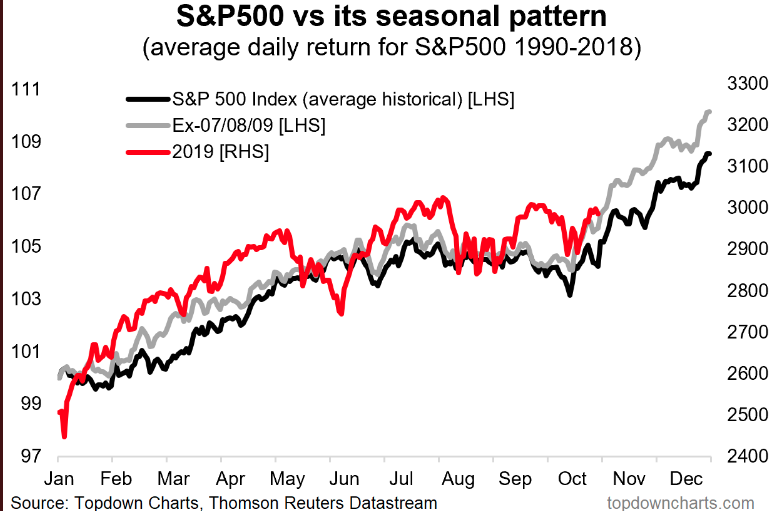
Regardless of what Mancini is predicting for the week ahead, the S&P 500 is on the doorstep of the best time to own stocks historically. As such, dips in the market should prove an opportunity and not provide investors with great fear. Additionally, the S&P 500 has followed the typical seasonal pattern that I've outlined in the past, which further suggests owning stocks over the next 6-month period.
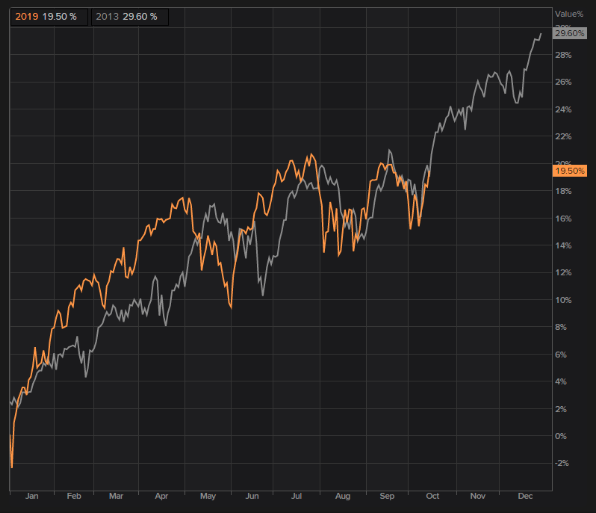
Digging a little deeper into analogous charts, we come to find that 2013's S&P 500 performance is almost identical to that of 2019, thus far.
So I'll round out this segment of the S&P 500 discussion and technical analysis with something a bit more concerning... Unfortunately, even as the S&P 500 tipped 3,000 once again, the Bullish Percent Index (SPXBPI) didn't get much higher than the previous week, akin to the 14-Day RSI. What we're seeing in the BPI is a divergence from the S&P 500, indicating market internals are weak.
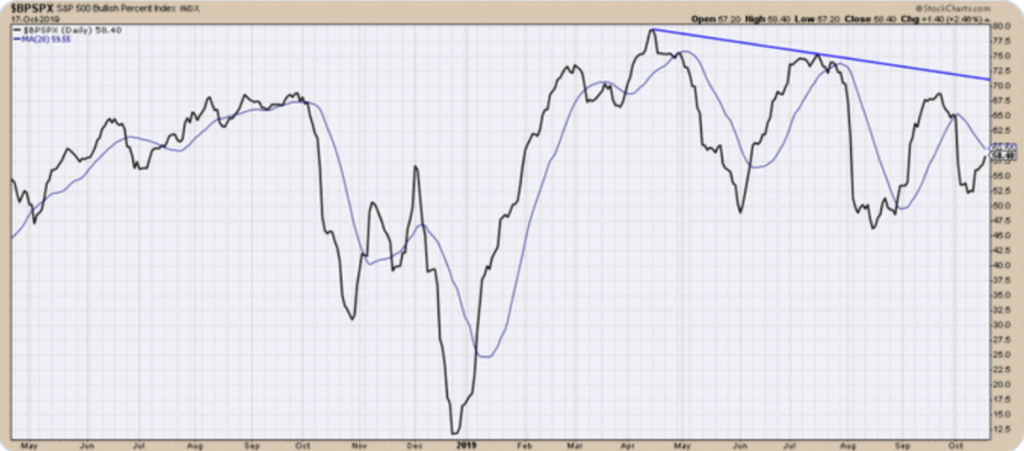
The SPXBPI compared to the S&P 500 itself is suggesting market internals have weakened. I want to be clear in this characterization: market internals have weakened, but they have not broken down. How can I definitively say they are not broken? The NYSE A/D line hit a new all-time high Tuesday and this is a longer-term buy signal! The net positive in a sea of murkiness!
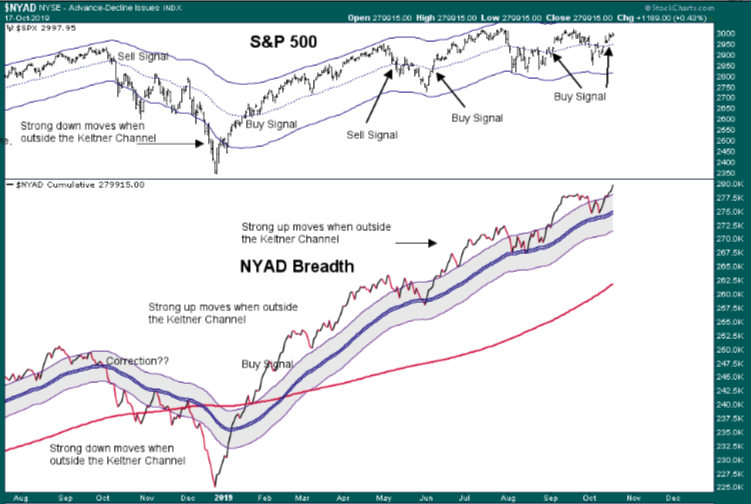
The S&P 500 and NYAD Breadth are both on buy signals presently, with the Keltner Channels - Midline producing the buy or sell signals. This does not mean that both can't come back down to the Midline with S&P 500 dropping in the coming week, it simply means that with the NYSE A/D line making new highs, that would represent a longer-term buying opportunity.
As displayed in many of the breadth/internals there is seemingly a lack of trust amongst investors to push the market beyond 3,000 and hold it above this level. Investors have seen 3,000 several times this year already and seen the level prove fleeting. As such, a breadth thrust of consequence has been lacking for each successive attempt at holding above the 3,000-level, even with the NYSE A/D line achieving successive new highs. Will earnings season and trade war de-escalation, in unison, provide the market with elevated belief and/or greater economic certainty going forward? This is the likely concoction of macro and micro needed to breakout of the elongated S&P 500 consolidation zone and surge through year end.
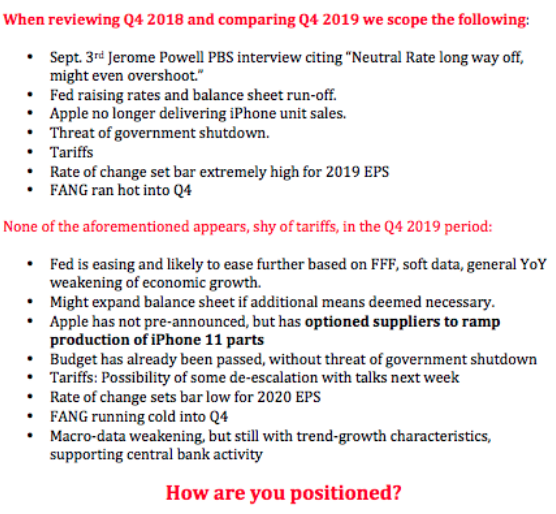
For the time being, Finom Group (for who I am employed) remains of the opinion, that any pullback near-term presents investors with a long-term opportunity to own stocks. A confluence of headwinds in 2019 have found the S&P 500 within a consolidation zone for which I believe will become tailwinds into 2020. Recall our Q4 2018 comparison with the present Q4 period discussed two weeks ago:
I might now add to this list of headwinds turning into tailwinds going into 2020 to include the recent decline in the U.S. Dollar index (DXY).
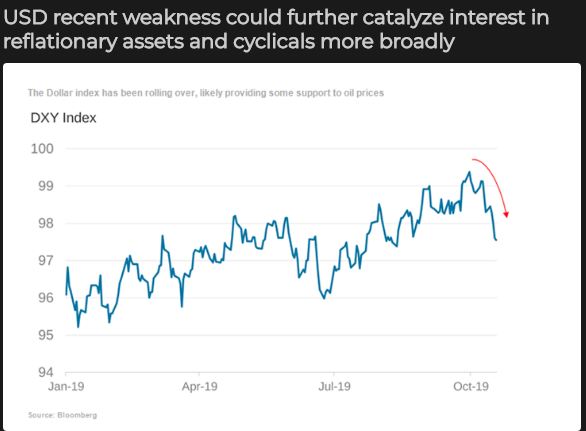
It's still to early to forecast the DXY's weakness going forward. A weakening DXY would prove a boon to S&P 500 EPS and revenues, as some 50% of S&P 500 revenues come from overseas. The DXY's strength has been the most heavily weighted call-out from CEOs on quarterly conference calls in 2019. If the DXY's recent weakness is to become sustainable, it will likely demand a favorable outcome from Brexit and a re-acceleration of global growth.
For the coming week, I would suggest investors consider the likelihood of some choppiness with bouts of volatility. The good news is that there will be no Fed speakers until the October 30th FOMC meeting and rate announcement. More importantly, earnings results will likely drive markets and that is what we desire to see most, even if earnings results don't produce the most positive outcomes for markets during the week. It would be nice to focus on earnings, the key driver of markets over time.
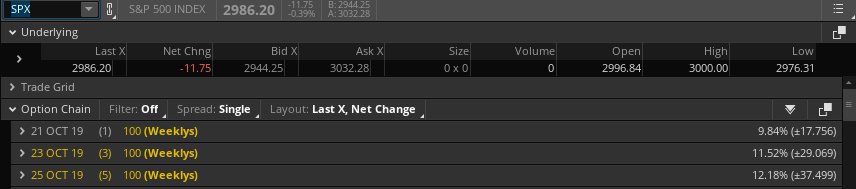
As it pertains to the weekly expected move for the coming trading week, there is less risk according to options pricing. Last week's weekly expected move was $51/points, which was not achieved for the week. With the VIX down two weeks in a row, losing another 8.5% this past week, the weekly expected move has been reduced to just $38/points.