
Will Overbought Conditions Offer A 5% Sale For S&P 500?
You see? It's not all rainbows and unicorns in the markets as they say and last week wasn't even a perfect example of the treachery that can beseech investors and traders. When it was all done and said; or for those of you who appreciate proper colloquialisms (all said and done), the S&P 500 (SPX) retreated roughly 1% on the week. The vast majority of the weekly decline was confined to Friday's broad market sell-off that found the Nasdaq (NDX) lower by .93% and Dow Jones Industrial Average (DJIA) slip .58% and cutting its intraday losses in half by the closing bell.
After a prolonged period of market complacency, improving market sentiment and exposure to equities, the long since heralded pullback may be afoot. It's only after such market conditions are found extended and become exhausted does a day like Friday seem to frighten the average investor, but make no mistake about it folks... "My Momma told me; There would be days like this."

Sometimes, you just have to realize that indeed and as Van Morrison said, "there will be days like this", days like this past Friday and days that are and will prove far worse than Friday.
All Things S&P 500
While the past trading week certainly ended with a whimper/sell-off, much of the weekly trading action was signaling a digestive period was in the midst of taking shape. Most trading sessions this past week were found with equities rising in the early hours of trading, only to give up most if not all of the gains by the European markets' close. Furthermore, as earnings season continued to roll forward, we've highlighted that good, bad or ugly earnings reports were all being found with selling pressure shortly after investors digested both results and valuations. Recall from Finom Group's (for who I am employed) published article, on January 22nd:
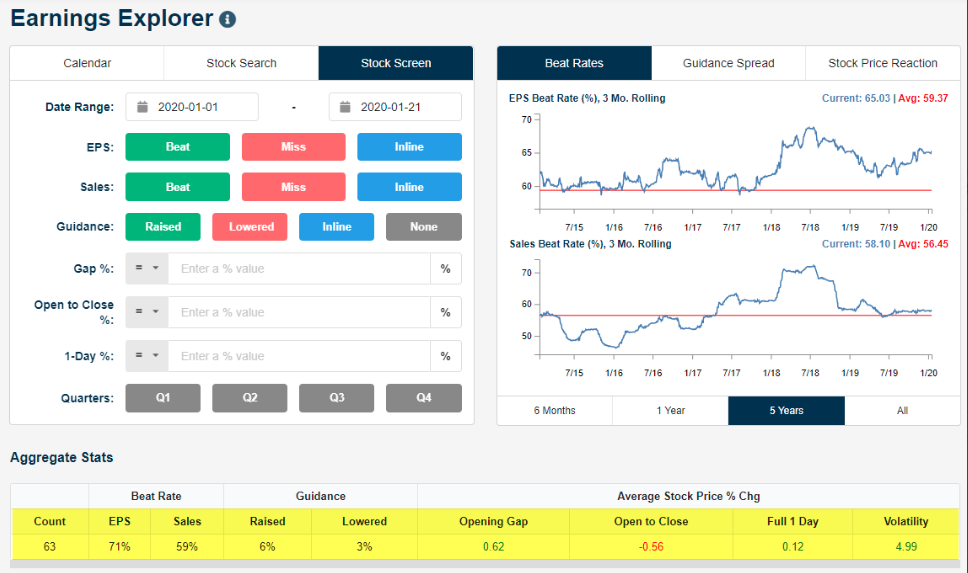
"According to Bespoke Investment Group, there have been 63 earnings reports so far in 2020. The avgerage stock reporting has opened higher by 0.62%, but fallen 0.56% from the open of trading to the closing bell. So we’re seeing investors use earnings season as a reason to lighten up, potentially locking in those profits."
The signs and there were many, for a period of digesting gains was ever-present and they are almost always present and in quantity. As always though; it's up to us as investors to evaluate the risk/reward equation. As a trader, whom tends to think with a more condensed timeframe in mind, the worst thing we could have done would have been to ignore the signals, the market breadth, and sentiment extremes.
One of the most substantial market signals we had discussed in previous reports and with Finom Group Premium members in the Trading Room was that of the S&P 500's deviation from it's 200-week moving average. As the benchmark index rose some 3% in the month of January alone, it stretched to 3-standard deviation territory above the 200-WEEK moving average.(Chart from Lance Roberts)
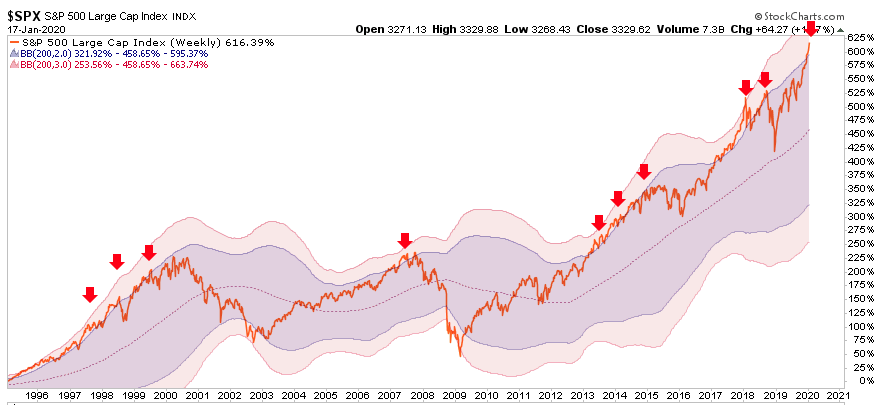
The big takeaway from the chart above, regarding the S&P 500's deviation from its 200-WMA, is that it doesn't spell the end of the bullish trend in place. No; it simply signals a digestive period is inevitable and that usually the trend continues unless an exogenous shock or excess leverage brings about an economic calamity. While we can't forecast an exogenous shock, we can suggest excess leverage in the economy is not within scope.
The S&P 500 chart above lends itself to the bulls longer-term, but also to the bears in the near-term. Additionally, while it may prove difficult to extrapolate any positives from last week's 1% drop in the S&P 500, nothing broke the uptrend in the market based on Friday's sell-off. Just didn't!
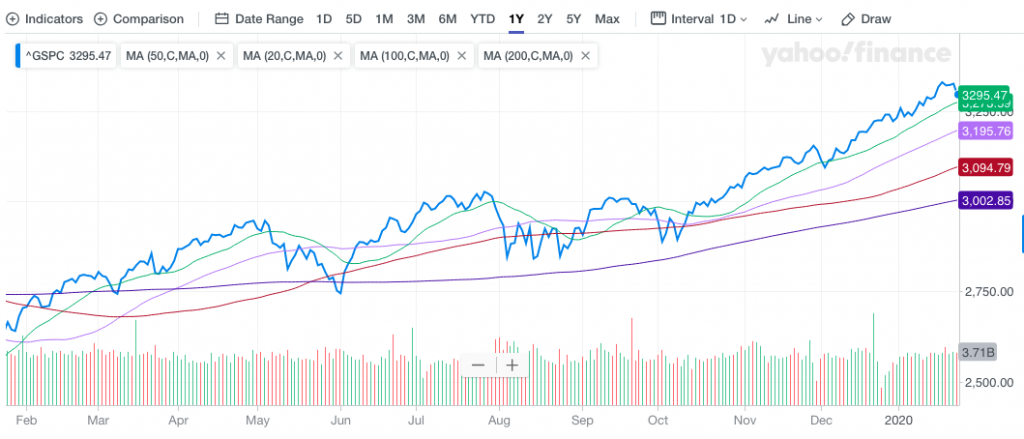
As depicted in the S&P 500 chart above, all 4 moving averages remain in an uptrend, curling higher and not yet curling lower. This is still a net positive for the bulls longer-term and suggests that any near-term distribution may prove to be just that, distribution and/or rebalancing efforts. The green line represents the 20-DMA, which also has yet to be touched at 3,278. Of course, that may prove the first moving average breach in the coming week given the understanding that further distribution is likely to be pared with the latest headlines concerning the spreading Coronavirus in China. And if that 20-DMA is breeched, the 50-DMA comes into play at 3,195. With that 3,195-level in mind, here's something I personally offered on StockTwits this past Friday as well:
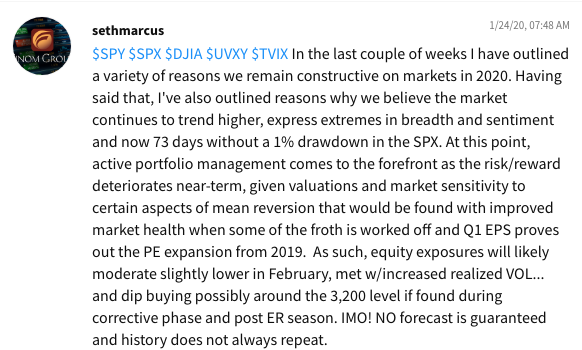
So here's the thing, and before I get into some other technical charts and dialogue:
- The S&P 500 topped at 3,337.77. Bank of America’s chief investment strategist Michael Hartnett expected that the S&P 500 would hit a target of 3,333 by March 3 in what he called a “front-loaded” 2020. Fantastic call by Hartnett!
- From the peak this past week, the S&P 500 has fallen roughly 1.2%.
- From the S&P 500 closing price Friday of 3,295 to the 50-DMA at 3,195, talk about your round numbers right... 100 points lower precisely.
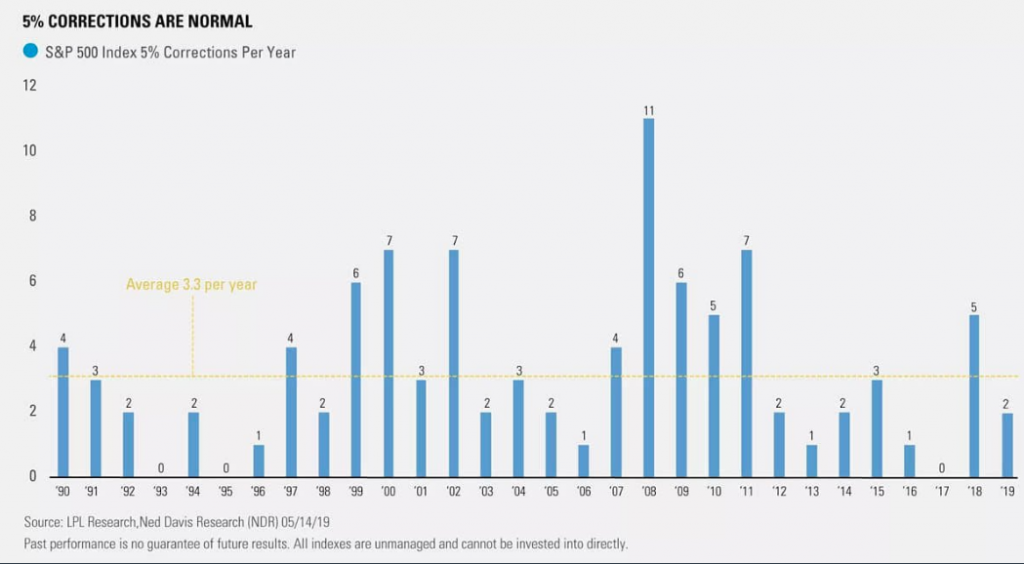
- If the 50-DMA at 3,195 is achieved, the "initial" pullback from peak-trough would equate to a roughly 4% pullback. Not quite the typical 5% pullback that occurs on average 3.3 times per year, but still. (5% corrections per year chart below)
So given those bullet points noted previously and assuming, simply assuming this will prove the start of a pullback, I would encourage traders and investors to game plan with those bullet points in mind. Set a course in motion for which to take advantage of such a pullback and with the notion that at least a 5% pullback is in the offering. Should market sentiment, technicals and/or fundamentals begin to show signs that a greater pullback is being presented, we can adjust our game plan accordingly and "come the time". This is not the time to be gobbling up everything in sight should the market move lower, but rather it is time to game plan and delicately digest what the market is delivering. If good stocks are being discounted with the broader market and post ER results, those are the opportunities to nibble, not gobble. If the market is truly going to digest some of the gains going back to October 2019 (12%+ gain since), you shouldn't digest more than you can nibble on presently.
The following chart of the S&P 500 is a beauty and while this past week the market outlook worsened near-term, the longer-term bullish trend should remain. With that being said, let's evaluate the chart offering from Ciovocco Capital. Three steps are shown in the chart below that lend themselves favorably to the bulls going forward, even though we are not likely to find the S&P 500 travel higher in a straight line.
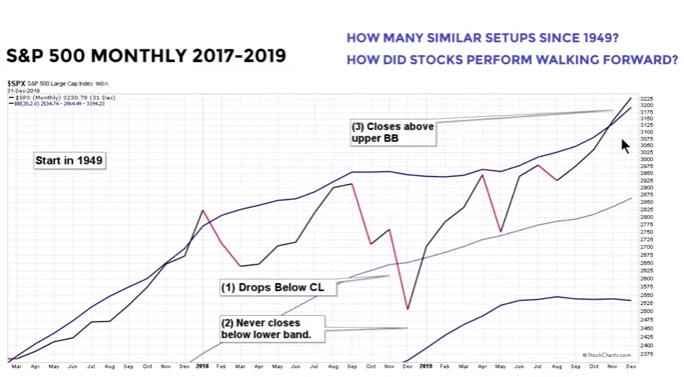
The first step in the chart identifies S&P 500's drop below the center line and closes below the centerline on a monthly basis. This was achieved! Step number 2 is that the S&P 500 needs to make a stand above the lower Bollinger band and never closes below that Bollinger band. This was achieved! Last, but certainly not least, the third point is a rally off of the low and get a close above the upper Bollinger band on a monthly basis. This was achieved as well! So what does this action tell us about the market going forward when all three steps have been achieved? I thought you'd never ask. Can we use you'd, just sounds wrong!

Despite what we might think about the economic outlook, the latest Coronavirus outcome and what the Fed might say this coming week, human behavior doesn't change all that much. For this reason, statistical data is quite relevant and lends itself well beyond where our biases come up short. The table above identifies all the occurrences for which was outlined in the S&P 500 "Bollinger band" chart analysis, dating back to 1954. Clearly, it's no wonder the market has begun to pullback 1-month after the S&P 500 has closed above and beyond the upper Bollinger band, which is also consistent with the 200-weekly moving average deviation noted.
If we take the results 2 months to 5 years out, however, the probabilities for the market to trend higher are rather high, extremely high in fact. History does not always repeat and there are no guarantees offered in any historic data. Nonetheless, the probabilities outlined in statistical data can assist us with long-term capital allocation decisions. To emphasize our previously outlined pullback game plan points, the table above also outlines the largest drawdown from the S&P 500 Bollinger band occurrences out 2 months was just over 6 percent. You might say that between a defined and typical 5% drawdown and the S&P 500 Bollinger band study/table, we could bookend a potential pullback at 6 percent. With all the aforementioned information, the average investor can more easily game plan!
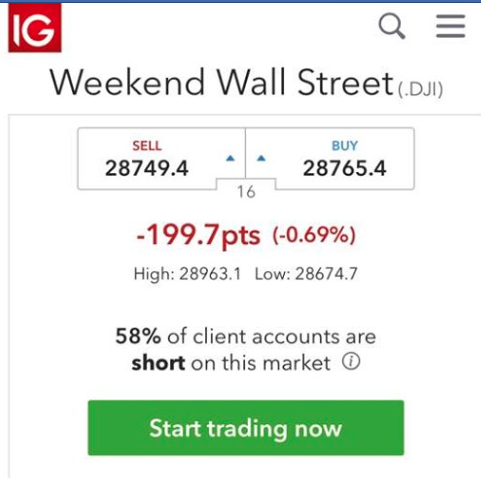
The coming trading week, in my earnest opinion, is likely to start off rather poorly. In fact, I would expect as much as a 1% intraday drawdown on the S&P 500 to happen either Monday or Tuesday. Simply put, the headlines over the weekend haven't improved around the Coronavirus and while I believe this to be just another momentary crisis that will be hyperbolized in the media, that's all it takes for the market to move lower after such an exhaustive move higher through the last 4 months. IG's Dow Futures betting already shows a triple digit loss also,which when added to the Dow's actual closing price on Friday equates to a drop of about 220 points.
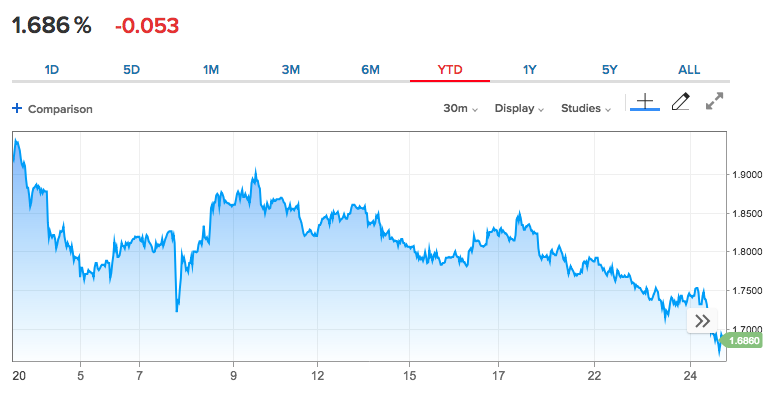
One of the things I've noticed since the 10-year peaked around 1.95% at the start of 2020, was a slow yet consistent downtrend in the benchmark Treasury yield. And this, while the S&P 500 traveled higher.
Owning Treasury Bonds are almost always a bad choice when compared to equities. Nonetheless, for every product there is a buyer and bonds do indeed have there place in the market. Owning bonds has been a poor choice since they were last at these levels in 2016 and earlier in 2019 to boot. Since 2016, bonds are up roughly 10.26% while the S&P 500 index ETF (SPY) is up some 67% over the same period. (Chart from J.C. Parets)

Another way to look at equities' outperformance when compared to bonds is in the following chart. It denotes the SPY:TLT ratio and defines SPY's outperformance compared with bonds. When the ratio is moving higher, stocks are outperforming bonds. When the ratio is moving lower, bonds are outperforming stocks. Additionally in 2019, the ratio moved above the upper Bollinger band as shown in the chart below:
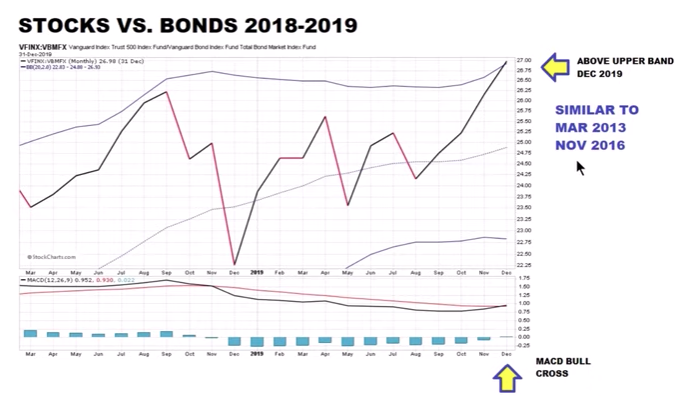
That's a critical achievement, historically, for the SPY:TLT ratio performance. The same thing happened in both 2013 and 2016. The SPY:TLT ratio rose above the upper Bollinger band in both cases. From April of 2013 to May of 2015, the S&P 500 rose 35.8% after the ratio broke above the upper Bollinger band. From December 2016 through January 2018, the S&P rallied 30% after the SPY:TLT ratio broke above the upper Bollinger band. Naturally, given the duration for which these gains were achieved, we can assume the S&P 500 didn't ravel higher in a straight line.
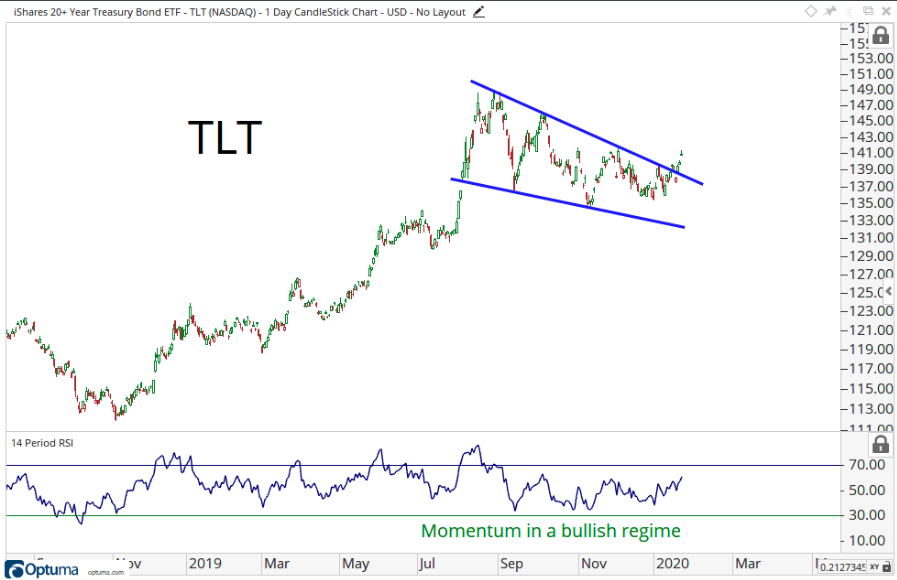
Of course, while the chart above paints a favorable picture for the S&P 500 to trend higher longer-term, that's not exactly what happened as of last week. This past week found the TLT outperforming the SPY, which may continue in the week to come. While we could suggest that big tech earnings may come to the equity markets rescue, thus far that simply hasn't been the case, even with better than expected earnings results. Just hasn't! Sometimes, the market has made up its mind to do what it wants to do and it appears as though it wants to digest some of the gains since October 2019 in favor of awaiting the Iowa Primary results and the longevity of the Coronavirus headlines. Additionally, least I not discount the sentiment shift that has taken place in the bond market ahead of the Fed curbing its bond-buying activities. Thus, bond prices are rising and equity prices have come under pressure. (SPX Green, TLT blue)

My forecast for the coming week suggests this price action (SPX:TLT) has a strong probability of continuation. As such, some investors may seek shelter or hedge their long equity exposures in the bond market or bond market ETFs. I'd be of the opinion that the TLT has an above-average probability of achieving $148-$150 per share in the next couple of weeks, which would likely see the 10-year yield challenge 1.6% to the downside, if not cracking into the 1.50% range altogether.
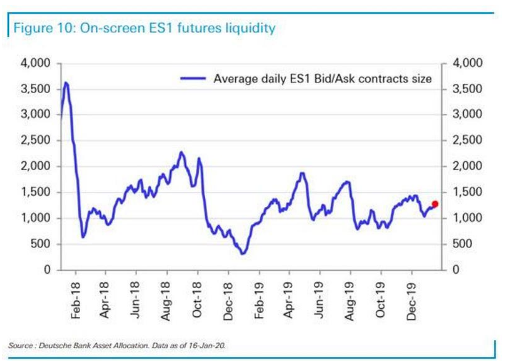
I don't believe the bull market is over folks; don't let the headlines fool or scare you into believing otherwise. Corrections or periods whereby the market digests strong gains from overextended rallies and market conditions are a natural occurrence. Within that last sentence, I beg of you to key on the word overextended. Why? To the degree the market has become overextended to the upside, it can take on the same characteristics to the downside, especially when market liquidity remains relatively low and markets are increasingly governed by algorithms.
Did you know that the S&P 500 is still up 2% in January. If it can close green in January 2020 this would be 5 consecutive higher months. So basically this means we can still lose 1.99% this coming trading week and remain in positive territory for the month. Since 1950, the S&P 500 has been higher a year after a 5-month win streak a remarkable 25 of 26 times. I like those odds! Buying begets buying, but's let's try and keep the selling to a minimum this coming week, shall we ;-)!
In addition to the longer-term positive outlook and near-term "fingers-crossing" activity, stocks historically tend to do pretty well the last week of January, although that may not prove the case this go around. (Chart from Ryan Detrick)
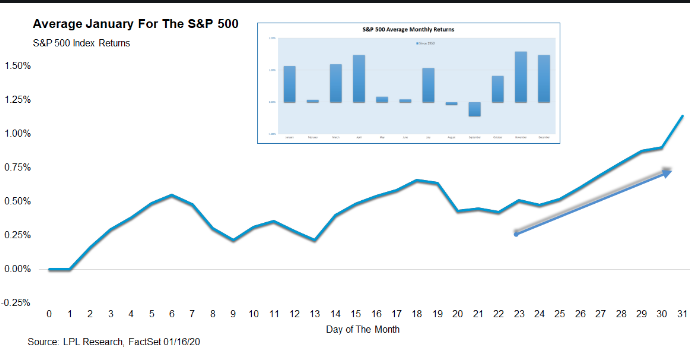
Maybe last week's lull in the market was just that, a lull? Maybe it is simply making up for the drawdowns that typically happen in the early portion of the month? Maybe the low rates, FOMC meeting and press conference coupled with supposed strong quarterly reports from AAPL, FB, SBUX,etc. will be enough to overcome still frothy market conditions, the negative and pervasive Coronavirus headlines. Too many maybes? Anyhow and as we head into February after this week, here's how the month has historically measured up:
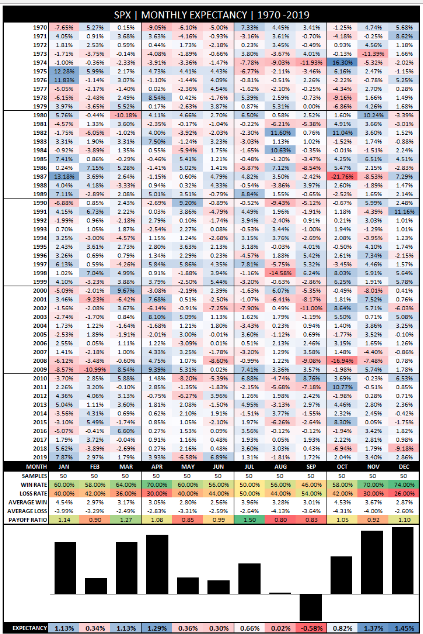
Although positive most of the time, February has historically been one of the worse performing S&P 500 months of the years in the way of returns. The table above dates back to 1970. The average loss for February has been almost equal to the average gain of just over 3 percent. The average gain for January has been over 4.5 percent.
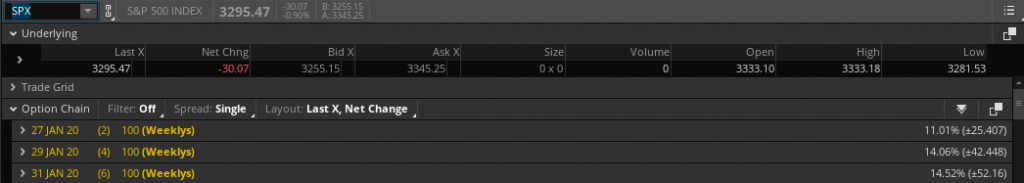
Alright folks, for the week ahead and the moment I have all been waiting for... the weekly expected move! The weekly expected move this past trading week was roughly $30/points, which was achieved to the downside and with the Friday decline. For the coming week and with the rise in implied volatility during the past trading week, the weekly expected move has jumped to $52/points.
It should be noted that such a move does imply additional risks associated with a further rise in implied volatility (VIX). The VIX rose some 20% last week, which seems like a large move, but is rising from relatively low levels that it sustained during the recent uptrend in the S&P 500. Before Friday, the VIX had only risen above 15 one time since October 2019.
Weekly Economic Data/FOMC Rate Announcement
It was a very light week in the way of economic data, but as it pertains to the housing sector, the string of strong data continued through the end of 2019. Sales of previously-owned homes jumped 3.6% in December, in spite of the fact that many people are struggling to find homes because of a low supply of properties for sale. Existing home sales in 2019 (5.344 million) finished the year essentially unchanged from 2018 (5.343 million).
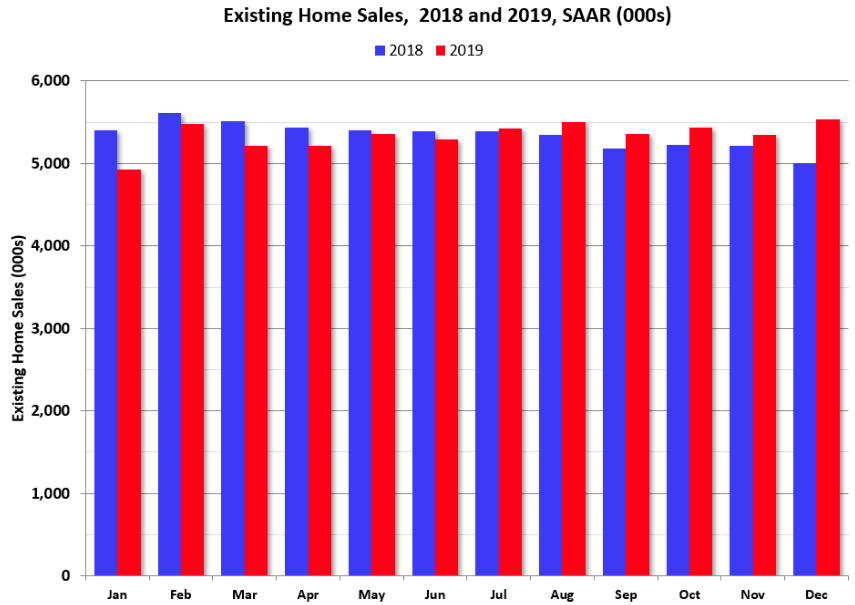
Existing-home sales occurred at a seasonally-adjusted annual pace of 5.54 million, the National Association of Realtors reported Wednesday. And the inventory of homes for sale dropped yet again, plummeting to a 3.0-month supply from a 3.7-month supply in November. That represents the lowest supply of homes since the National Association of Realtors began tracking this data in 1999. The general rule of thumb is that a 6-month supply is indicative of a balanced market.
According to Bill McBride of the Calculated Risk blog, he hasn't seen this kind of existing home sales inventory imbalance in a very long time.
"Inventory always decreases sharply in December (seasonally as people take their homes off the market for the holidays), but I have three decades of inventory data - this was the lowest level of inventory in my data base."
This coming week, we'll have more housing sector data announced, but before we get to that let's further discuss jobless claims. As expected this week, claims rose off of the recent lows albeit by a less than expected amount. Initial jobless claims were expected to increase to 214K but instead only rose to 211K. (Charts from Bespoke Investment Group)
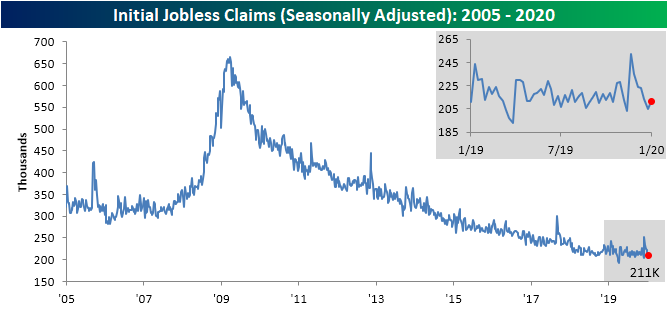
Moreover, the four-week moving average has fallen further. The moving average has fallen each of the past 3 weeks, as the much higher readings from around Thanksgiving have rolled off the average. Keep in mind, the huge spike in claims from November, not only elevated the 4-week moving average in claims but negatively impacted the latest reading in the Leading Economic Index. Nonetheless, this week’s Initial Jobless Claims print brings the average to 213.25K which is the lowest since the end of September. Additionally, that is a drop of over 20K from the recent peak of 233.5K in the final week of 2019.

While housing and the labor markets appear strong, the overall Leading Economic Index wasn't as favorable for the economic outlook. But as stated earlier, there were some anomalies that took place in November that weighed down the LEI.
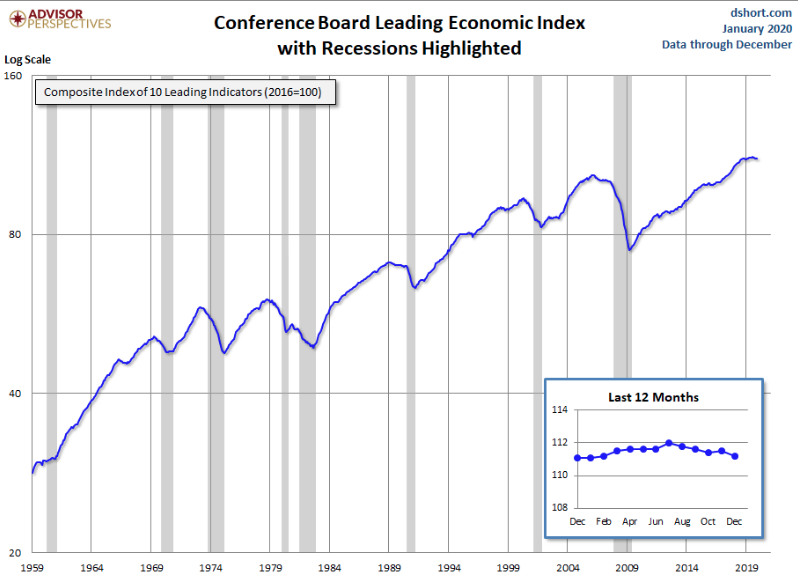
- The leading economic index fell 0.3% in December to mark the fourth decline in the past five months, the Conference Board said.
- The drop in the index largely stemmed from an increase in jobless claims and a decline in building permits for new houses, but claims have fallen since then and the weakness in permits is seen as temporary.
- Building permits were also weak in December, but construction on new homes actually hit a 13-year high. Permits are trending well above year-ago levels, and with mortgage rates falling again, are likely to rebound in January.
- Financial conditions and consumers’ outlook for the economy remain positive, which should support growth of about 2 percent through early 2020.”
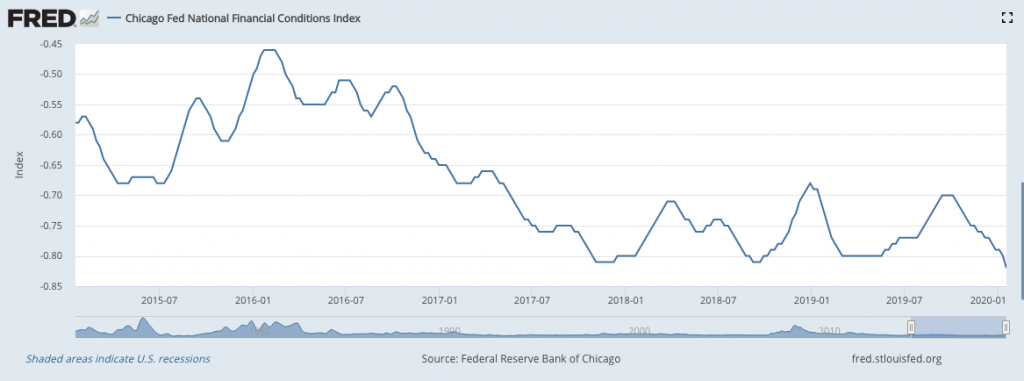
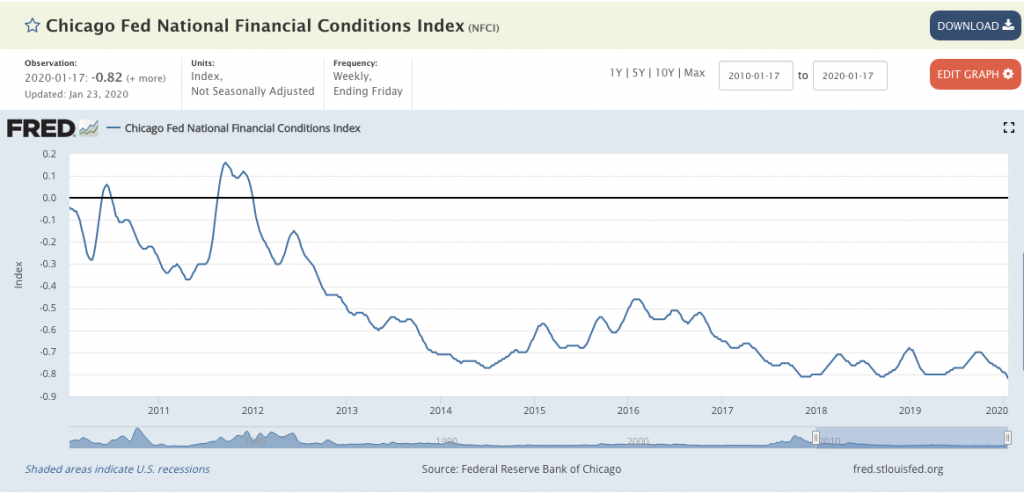
The last bullet point is an important one as it relates to financial conditions and the strength of the U.S. consumer, which comprises some 70% of GDP. The Chicago Fed National Financial Conditions Index is at its lowest level in the last 5 years, suggesting loose or accommodative monetary policies. This is what I want to see and just one of the many reasons Finom Group believes the expansion cycle will carry on and through 2020, without a recession. This is not to suggest the expansion will not be found without its fare share of potholes, but I should think they can be side-stepped with little difficulty. Back to the LEI...
In reviewing the weakened LEI at year's end 2019, while it is indeed weakened, the threat of a recession seems unlikely. For a better understanding of the relationship between the LEI and recessions, the next chart shows the percentage-off the previous peak for the index and the number of months between the previous peak and official recessions.

Again, if solely basing a recession model on the LEI, it would appear as though a recession will not be found in 2020. Of course, however, LEI is not the only input for recession models. For the coming week, the economic data calendar gets a bit more relevant and is highlighted with New home sales slated to be released first thing Monday morning.
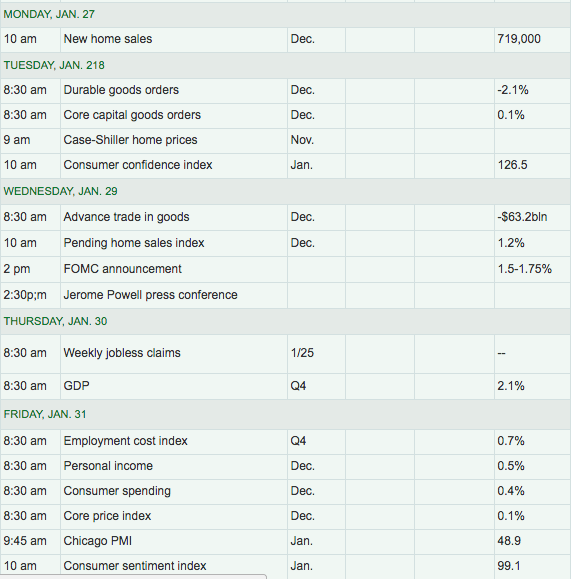
Some of the other key pieces of economic data due out this coming week include Durable goods orders, which have slumped in 2019, the first look at Q4 2019 GDP and the Personal Income and Expenditures data (PCE). Of course, the PCE data is the Fed's preferred method for benchmarking inflation and as such, isn't it fitting that it should be released during an FOMC meeting week.
Nobody is expecting much out of the Fed this coming week, as most economists and market participants aren't forecasting any action on rates for the duration of 2020. Nonetheless, the post-rate announcement press conference always proves to provide investors with angst. Here's what Marc Chandler of Marc to Market had to offer with respect to previewing the upcoming FOMC meeting this coming week:
"With a press conference after every FOMC meeting, and given Powell's perceived communication challenges, it is difficult to say that the January 29 meeting is a non-event. Still, for all practical purposes, it is. There is scope for a small technical adjustment. The Fed pays 1.55% interest on both required and excess reserves. It could raise this by five basis points to ensure the fed funds rate remains within the 1.50%-1.75% target range. Many who think the Fed's bill buying and repo operations represent an easing of monetary policy (as in QE), they may argue that the Fed is tightening. However, most will likely conclude that it would be a technical adjustment and not a change in monetary policy proper.
The forecasts will not be updated until March, and the economy has not materially deviated from Fed expectations. Last year, some media reports played up the two persistent dissents against the series of rate cuts and argued Powell was losing control. However, this does not seem to be the case, and indeed a clear consensus has emerged. At the December meeting, 14 of the 17 officials thought no rate change would be needed this year."
And then there is Goldman Sachs. By and large it seems as though this latest FOMC meeting is set to be a "snoozefest". Of course when everyone is leaning to one side of the boat, sometimes bad things can happen... sometimes!
Goldman: “The FOMC is set to keep the target range for the funds rate on hold ... next week. ... Economic conditions have changed little ... while financial conditions have eased significantly further. ... we expect the funds rate to remain unchanged in 2020.”

The chart above relates to the latest BofAML Fund Manager Survey (FMS). The S&P 500 tends to perform well when cash levels are low amongst fund managers and they have confidence in the economy. While we await the actual results for Q4 2019 GDP, there will likely be at least one more round of adjustments to the forecast before the release of the data this coming week. At present, the CNBC Rapid Update forecast shows a consensus estimate of 2.1% GDP growth, which is at the upper end of most forecasts. The Bloomberg survey also has a median forecast of 2.1 percent. The Atlanta Fed will update its forecast on January 28th. The present Q4 GDPNow forecast shows the regional Fed bank to be 1.8% for the final quarter of 2019.
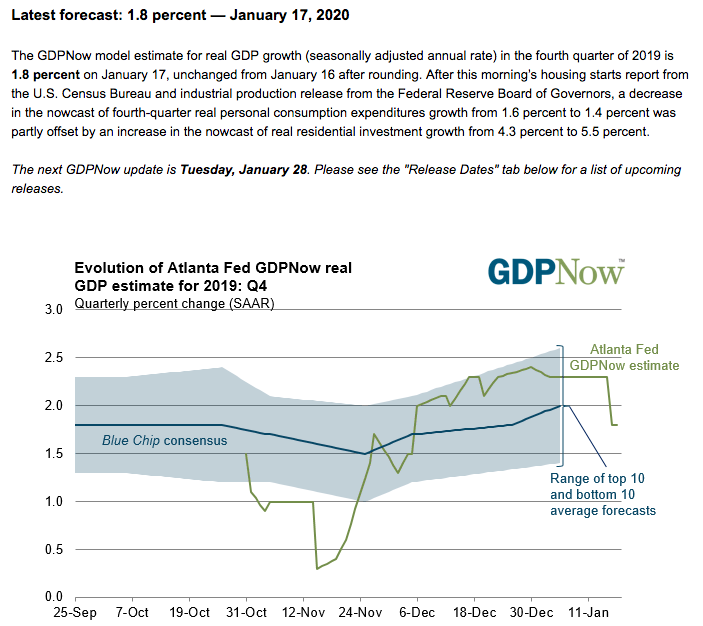
JPMORGAN: “Global growth for 4Q19 is still looking soft, .. following a weaker-than-expected US industrial production report for December and softer retail sales for the quarter after revisions, we revised down our forecast for 4Q19 US GDP growth to 1.5% q/q saar (from 2.0%) ..”
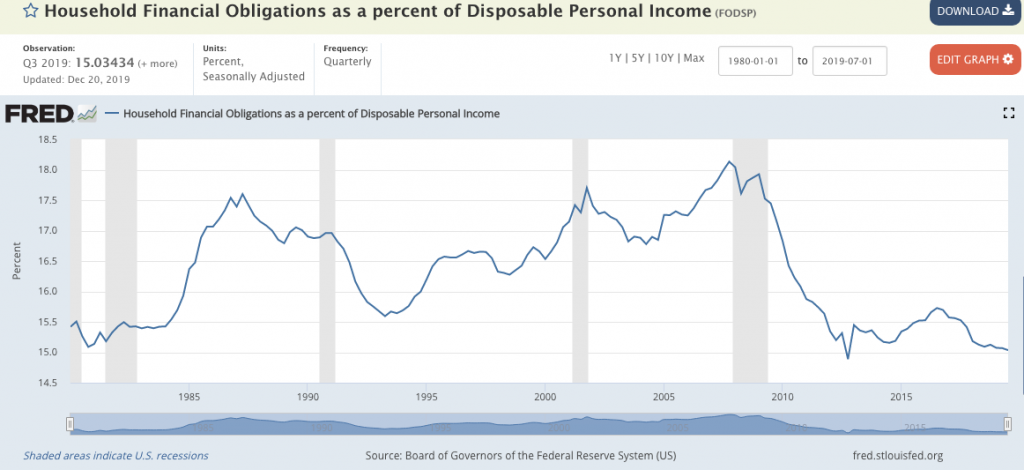
I continue to define the greatest strength of the U.S. economy comes from its improved consumer behaviors. The consumer has rebuilt their balance sheet since the Great Financial Crisis and it now stands in the best position it has been in since the 1960s. Wages continue to rise through the longest expansion cycle in history as household debt obligations as a percentage of Disposable Income continues to trend lower.
Another ongoing discussion and data point I highlighted throughout 2019 and into 2020 is the Personal Savings rate.
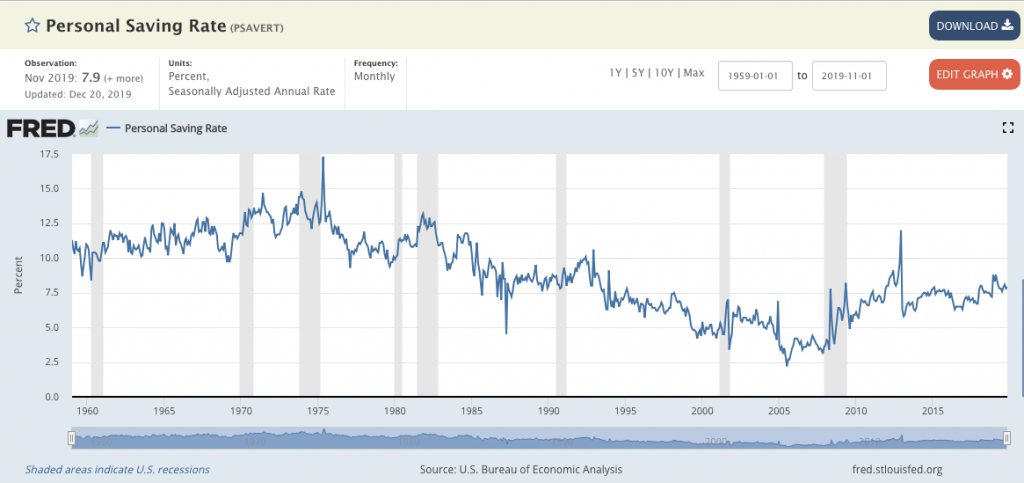
This is, or this remains, the first expansion cycle since the 1970s whereby the savings rate has actually increased through the expansion cycle. This is one of the reasons why I've suggested there has been marked improvement in consumer behaviors. While I do not discount the ever-increasing amounts of debt that are accrued annually, it is not being accrued in a manner that isn't serviceable. But even so...
Things go wrong, go awry and of course...right? Even if that should prove the case in 2020, I don't find recessionary conditions on the horizon absent an exogenous shock to the economy. With that said, me thinks, me said enough and we should probably here from another voice in the crowd of market opinions.
Jeffrey Kleintop of Charles Schwab suggests that there are always things to worry about as an investor and regardless of what one believes the outcome will be for any particular year. With that in mind, he offered his top 10 risks for 2020 as outline in the text below:
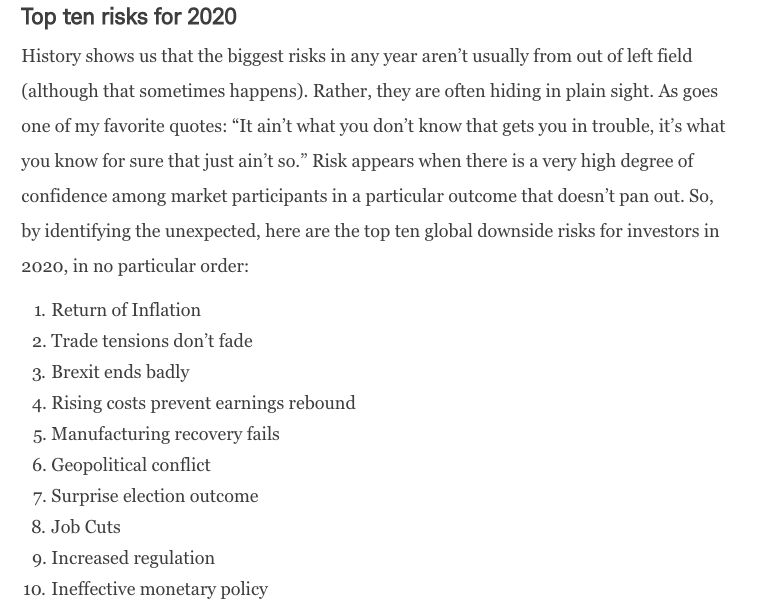
And by the way, let us keep in mind that on January 31, 2019 the United Kingdom will officially be leaving the European Union. So with regards to Jeffrey's #3, we won't really know if Brexit will end badly until the end of 2020, as they have until then to negotiate trade deals with the European Union. Even so, Jeffrey also offers some upside surprise potential, which to some degree is already being seen in the Eurozone economic data.
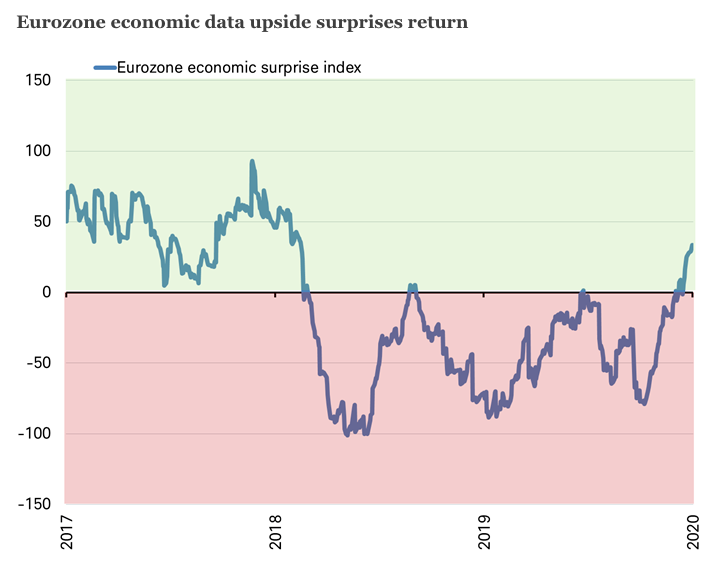
Upside surprises
"Of course, it’s not all negative. There may be upside surprises in 2020 as well, such as: meaningful fiscal stimulus by world governments, a rebound in business spending, and a reacceleration in China’s economy. With the latest reading for the OECD’s global composite leading indicator ticking up for the first time in two years, perhaps global growth may pickup in 2020, rather than merely stabilize.
As we consider unexpected positive impacts, it’s worth noting that European economic data has been surprising on the upside in recent weeks, after disappointing economists in both 2018 and 2019."
Bottom line, regardless of what the market does near-term, the economy is on solid footing given that the consumer remains strong, disciplined and some 70% of economic activity. We can't forecast the outcome of the latest headlines that drive fear amongst the investor community, but we can rationalize long-term drivers of the market along the lines of economic data and earnings growth. In 2020, we see a continuation of trend growth GDP (1.7-2.3%) and a rebound in earnings.
In terms of GDP, the market is largely a forward pricing mechanism, already pricing in future growth, which translates to pricing in 12MFWEPS. It's with this in mind that the current earnings season underway has already been rationalized in the P/E expansion that took place in 2019. What we really need to see are those Q1 2020 results, which won't be delivered until April-May 2020. Until then...
Fund Flows, Stinking Up The Joint Again? Nope!
You have probably already heard it by now, but bond fund flows are picking up where they began and traveled through much of 2019. And just to be clear folks, bond fund flows to start the year are annualizing at $1 Trillion pace, which is very much unsustainable.

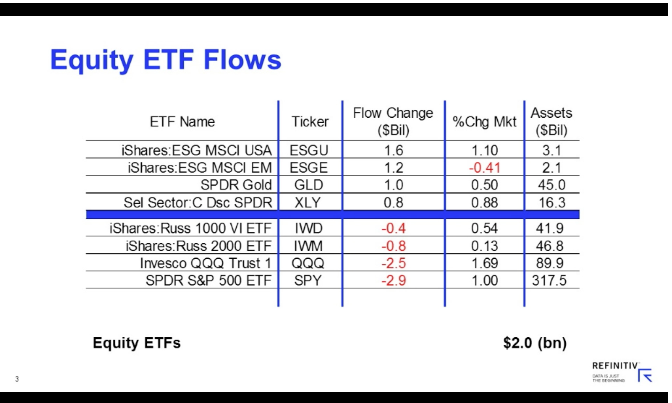
According to Lipper FundFlow Weekly Insights, (1 week behind reporting) for the fifth week in a row, equity ETFs witnessed net inflows, attracting $2.0 billion for the most recent fund-flows week. Authorized participants (APs) were net purchasers of domestic equity ETFs (however, taking in just $200 million) for the fourth consecutive week of net inflows. Meanwhile, nondomestic equity ETFs witnessed net inflows for the fifth week running, taking in $1.8 billion this past week. iShares ESG MSCI USA ETF (ESGU, +$1.6 billion) and iShares ESF MSCI EM ETF (ESGE, +$1.2 billion) attracted the largest amounts of net new money of all individual equity ETFs. At the other end of the spectrum, SPDR S&P 500 ETF (SPY, -$2.9 billion) experienced the largest individual net redemptions, and Invesco QQQ Trust 1 (QQQ, -$2.5 billion) suffered the second largest net redemptions of the week.

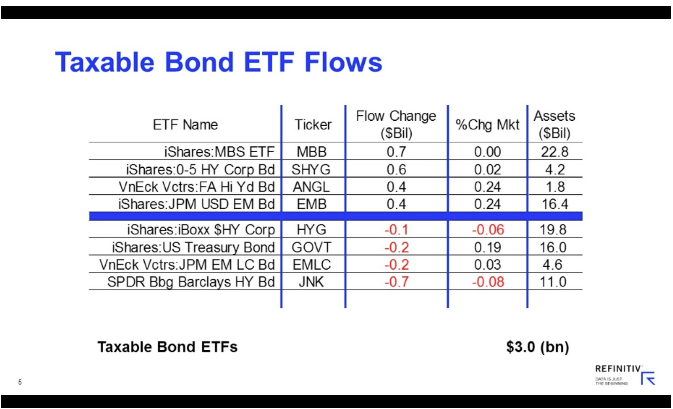
For the seventh consecutive week, taxable fixed income ETFs witnessed net inflows, taking in $3.0 billion. APs were net purchasers of corporate investment-grade debt ETFs (+$1.0 billion) and government-mortgage ETFs (+$773 million). iShares MBS ETF (MBB, +$682 million) and iShares 0-5 Year High Yield Corporate Bond ETF (SHYG, +$554 million) attracted the largest amounts of net new money of all individual taxable fixed income ETFs. Meanwhile, SPDR Bloomberg Barclays High Yield Bond ETF (JNK, -$726 million) and VanEck Vectors JP Morgan Emerging Markets Local Currency Bond ETF (EMLC, -$238 million) handed back the largest individual net redemptions for the week. For the sixteenth week in a row, municipal bond ETFs witnessed net inflows but took in just $62 million this week.
While we continue to see bond inflows outpace equity inflows by a wide margin, we can't help but to recant J.P. Morgan's "Great Rotation" thesis issued last year. They were and remain of the opinion that there will be a great rotation out of bonds and into stocks in 2020, with the retail investor also providing some wind in the sails of equity fund flows.
Unfortunately, the retail investor largely missed out on the resurgence in the stock market in 2019. Even more unfortunate, they apparently remain skittish based on the first week of the 2020's fund flows, according to BofAML fund flow reports.
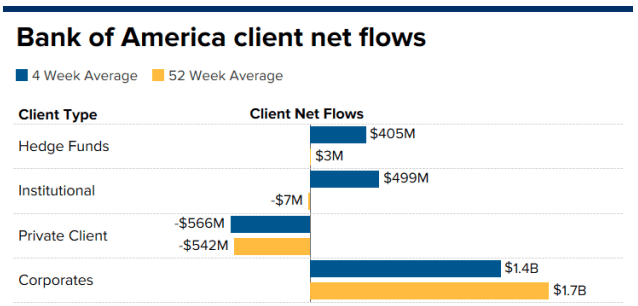
Data from Bank of America Securities showed a $550 million net outflow for the bank’s clients during the first week of the year. The same data showed that the clients were net buyers of equities in 2019, but that was driven almost entirely by corporate buybacks. Individual investors were the biggest net sellers.
If you're looking for a catalyst for the market in 2020, it's likely going to come from increased retail investor leverage to the market coupled with post-Iowa Primary fund flows from the institutional investor community. So long as the Iowa Primary isn't found with a progressive candidate winning the Primary, the pullback that I've presumed is afoot may not last too long, although I can't propose with precision its depth, but rather approximate duration.
Last week, the “Great Rotation II” thesis was discussed by J.P. Morgan once again. J.P. Morgan noted that a measure of individual investor leverage actually fell in 2019, even as stocks put in one of their best annual performances since the 2008 bear market.
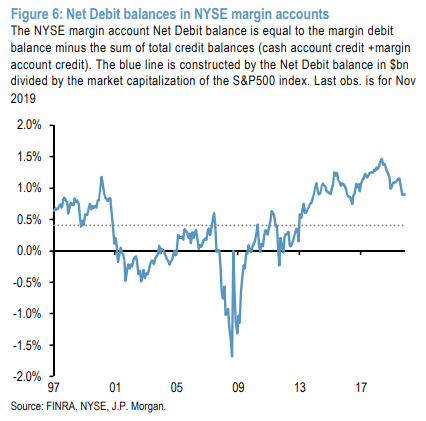
“The previous extremity in US individual investor leverage seen in Q2 2018 has been largely unwound, but what is more striking is that [NYSE Net Debit balances] declined last year despite strong equity market performance.
This again shows how unwilling US retail investors were last year to leverage their equity bets”, he went on to suggest, before noting that “this unwillingness might indicate that leveraged US retail investors feel that their equity exposures and leverage are already elevated and are thus reluctant to add with the equity market at historical highs”.
One of the greatest reasons J.P. Morgan's analysts believe in the Great Rotation II thesis is that stocks remain with the best risk premium.
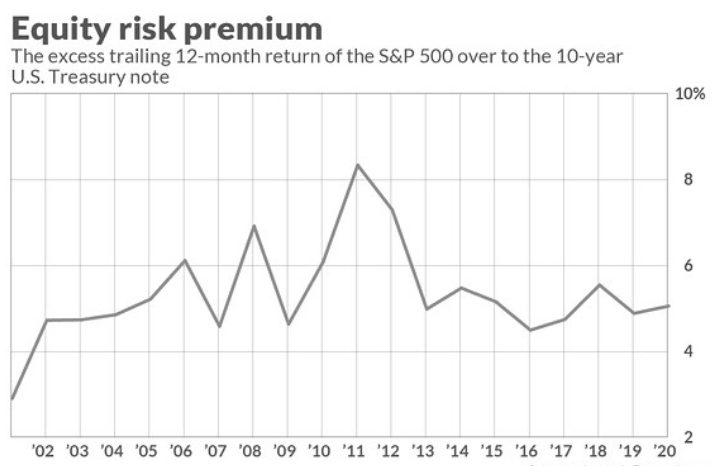
The equity risk premium, which also describes the relationship of the stock market to the bond market, argues that stocks remain a good investment. While the equity risk premium is below levels seen in the years following the financial crisis, investors are being compensated for equity risk at a higher rate today, 5.1%, than historical average of about 4.6%, according to Aswath Damodaran, professor of corporate finance and valuation at NYU’s Stern School of Business. In other words, the equity risk premium remains relatively high or attractive for investors.
Earnings Outlook
With roughly 2 weeks worth of the earnings season period in our rear-view window, we are starting to see an improvement in the Q4 2019 EPS forecast. Banks and financial institutions largely reported strong results with reasonably strong guidance, thus proving the EPS growth rebound forecasted for 2020 was not overly optimistic. In addition, the forecasts for 2020 to-date further evidence that the flat EPS regime in 2019 was largely due to "rate-of-change" and not necessarily weakened demand. Of course, sales will have grown in 2019, but profit margins will have likely declined due to the strong dollar and moderate increases to input costs, largely due to tariffs imposed since late 2018.
In the previous week Refinitiv was forecasting Q4 2019 EPS to decline by .6% YoY. That forecast has modestly improved in the most recent week ended January 24th. The firm's forecast is noted below:
Aggregate Estimates and Revisions
- Fourth quarter earnings are expected to decrease 0.5% from 18Q4. Excluding the energy sector, the earnings growth estimate is 2.4%.
- Of the 85 companies in the S&P 500 that have reported earnings to date for 19Q4, 68.2% have reported earnings above analyst expectations. This compares to a long-term average of 65% and prior four quarter average of 74%.
- 19Q4 revenue is expected to increase 4.5% from 18Q4. Excluding the energy sector, the growth estimate is 5.7%.
- 64.7% of companies have reported 19Q4 revenue above analyst expectations. This compares to a long-term average of 60% and an average over the past four quarters of 58%.
- For 19Q4, there have been 77 negative EPS preannouncements issued by S&P 500 corporations compared to 35 positive, which results in an N/P ratio of 2.2 for the S&P 500 Index.
- The forward four-quarter (20Q1 –20Q4) P/E ratio for the S&P 500 is 18.8.
- During the week of Jan. 27, 141 S&P 500 companies are expected to report quarterly earnings.
If the energy sector is excluded, the growth rate improves to 2.4%. The S&P 500 expects to see share-weighted earnings of $333.8B in 19Q4, compared to share-weighted earnings of $335.3B (based on the year-ago earnings of the current 505 constituents) in 18Q4.
The utilities sector has the highest earnings growth rate (13.1%) of any sector. It is expected to earn $8.2B in 19Q4, compared to earnings of $7.3B in 18Q4. All five sub-industries in the sector are anticipated to see higher earnings than a year ago. The independent power producers & energy traders (81.8%) and multi-utilities (16.2%) sub-industries have the highest earnings growth in the sector. If these sub-industries are removed, the growth rate declines to 8.3%.

Based on the chart above, which offers Refinitiv's revenue, net income and EPS growth outlook for 2020-2021, the firm is forecasting S&P 500 EPS growth of 9.5% in 2020.
Unfortunately, FactSet has yet to update their week-to-week estimates and/or forecast. We do expect an update come next week and after some fo the bigger tech stocks report results in the coming week. Below is a graphic of some of the highly anticipated results due out this week, highlighted by the likes of Apple (AAPL), Starbucks (SBUX), Boeing (BA), Tesla (TSLA), Visa (V), eBay (EBAY), Facebook (FB) and more.

Absent an updated forecast by FactSet, the firm has taken notice of the beat rate during the earnings season, which is a little subdued after the first couple of weeks through earnings season. To date, 17% of the companies in the S&P 500 have reported actual results for Q4 2019. It's early folks, and the mega-cap titans of tech will lend themselves to either worsening or improving the beat rate for earnings season.
- In terms of earnings, the percentage of companies reporting actual EPS above estimates (73%) is above the five-year average.
- In aggregate, companies are reporting earnings that are 3.2% above the estimates, which is below the five-year average. In terms of sales, the percentage of companies (67%) reporting actual sales above estimates is above the five-year average. In aggregate, companies are reporting sales that are 1.3% above estimates, which is also above the five-year average.
Insight/2020/01.2020/01.24.2020_EI/S&P%20500%20Earnings%20Above%20In-Line%20Below%20Estimates.png?width=920&name=S&P%20500%20Earnings%20Above%20In-Line%20Below%20Estimates.png)
Investor Takeaways
What's the catalyst to buy the market at it's current valuation? That's the question investors need to ask themselves and within the context of the risk/reward equation. For long-term, long-only investors, I understand this question may not pertain to you. Nonetheless and in terms of value, maybe it does.
The market has melted higher since October 2019 and achieved record highs along the way. The achievements have also come after a year of flat earnings, which has resulted in a good deal of multiple expansion. This has led to a cyclical high in the P/E ratio, and investors likening the current period to that of the dot-com era. Folks, this is nothing like the dot-com era, as shown in the chart below.

As we can see from the chart above, the S&P 500 P/E ratio was much higher than it is today, and that was with rates significantly higher than where they are today. I can't stress enough how important it is to qualify valuation with respect to risk premium and the trajectory of bond yields, which have historically moved inversely to the equity market. I expect yields to remain low through most of 2020, reinforcing or supporting equity market valuations. One might suggest that where there were 2 "puts" underneath the market in 2019, there are now three.
- Fed put
- Trump put
- SPX:TLT put
None of this is to suggest the market can't or shouldn't correct between now and the back half of the year, but rather it elevates where the perceived depth of a correction MIGHT go before investors reassess/rerate risk. The higher the risk premium becomes for equities, given lower yields, the sooner investors are inclined to rotate or allocate back into equities.
Analysts at Société Générale say U.S. stocks appear a much more attractive proposition over bonds thanks to the widening of the average equity risk premium. In recent months, this premium has risen due to the inability for bonds to sell off, even though investors anticipate a stabilization in the global economy after the signing of the phase one U.S.-China trade deal. I think that this is just one more example that identifies that bonds are not really a reflection or read on perceived economic strength or weakness, but rather a product of the financial system's construct and perception of the national debt serviceability. It's either that or the trajectory of bond yields have a history of lying to every economist since inception. Yields, no matter what the monetary policy has been, have declined over time and to the point where some regions of the world are expressing negative-yielding debt. The days of, "bonds are telling us something about the economy" have long since ended in my opinion.
Citibank analysts calculate that stocks have a near 90% chance of recording gains over the next 12 months given current cyclically-adjusted price-to-earning ratios and forward swap contracts for the 10-year Treasury yield.

In 2019 and when the 10-year yield dropped below 1.5% only for the second time since 2016, I suggested investors would be rewarded for staying long equities and shorting volatility. While I can't propose the same with regards to volatility, as volatility is more nuanced in 2020 due to the heightened state of sensitivity that coincides with an election year, I can suggest being long equities should yields drop further and absent a recession.
“Financing terms are too easy to cause a major economic or market tumble and central banks remain pliant, said Citibank analysts.
Citibank is right. Financing terms or financial conditions remain extremely low and loose as yields remain under pressure and the stock market has trended higher through 2019 and into 2020. Having said all of that, I'm not going to be in the business of avoiding the whole impact on markets from the Coronavirus. But it's important that we keep a level-headedness through the hyperbole and angst it has already proven to cause.
If we liken the Coronavirus to SARS in 2003, which the WHO has already ruled out to a great degree, the Coronavirus is likely to hit with a bang but fade with a whimper. Nonetheless if we do use SARS as a comparison, this really isn't the reason for a market to pullback. According to Dow Jones Market Data, the S&P 500 posted a gain of 14.59% after the first occurrence of SARS back in 2002-03, based on the end of month performance for the index in April, 2003. About 12 months after that point, the broad-market benchmark was up 20.76 percent. This is usually the response from markets and has been as shown in the following chart from Dow Jones Market Data:
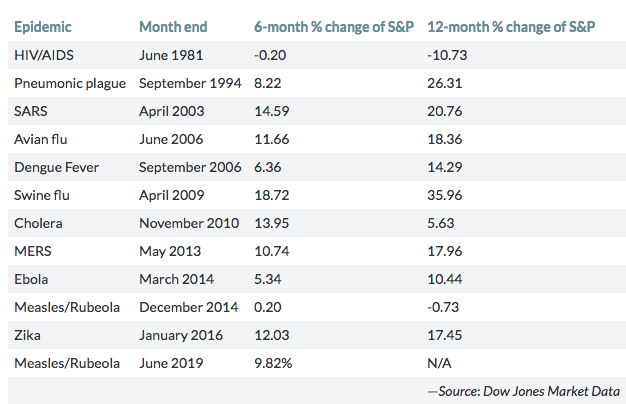
Most of the time, the market has an initial adverse reaction to these supposed pandemics that never come to be. Zika was actually preceded by the Ebola outbreak, which was all the craze in 2014, but didn't really register on the S&P 500 pullback-radar but for more than a couple of weeks. SARS coincided with the onset of the Gulf War. Nonetheless, here is what the WHO had to say about the current outbreak in China:
“It’s too early to consider that this event is a public health emergency of international concern,” said Didier Houssin, chairman of an emergency committee that studied the outbreak. Members of the committee were divided on the matter, he said.
WHO Director-General Tedros Adhamom Ghebreyesus said he would reconvene the committee if the situation changes—even if that happens in the next couple of days. “This is an emergency in China, but it has not yet become a global health emergency,” he said. “It may yet become one.”
So far, the Wuhan virus appears to be milder than SARS or MERS, though it has sickened some people severely and there have been deaths. MERS killed about a third of those infected, while SARS resulted in the deaths of about one in 10. By contrast, the mortality rate from the Wuhan virus is tracking at roughly 3%. Many patients who have died were over 60 years old, had other illnesses such as diabetes and were admitted to hospitals when their illness was advanced.
I don't discount that the Coronavirus may become a global health emergency, but I would suggest this is a low probability and especially given the measures already being put forth by China and other countries. Additionally, I'd like to remind investors that outbreaks are noise to S&P 500 returns. Earnings, liquidity, momentum, trend and disinflation are all far more impactful and consistent than any such outbreak. Not that I wish this upon the world, but such outbreaks in no way, shape or form register the level of fear that A.I.D.S. carried with it in the 1980s. As such, let's move on to the more realistic market probabilities and outcomes based on what actually drives markets, earnings.
We'll have to see if the market holds it's January 2020 gains in the coming week, but even if it doesn't, we don't expect a February 2018-like market reaction simply because we've experienced breadth and sentiment somewhat akin with that period. The situation is grossly different today when compared to 2018 where the Fed was raising rates, the housing sector was in decline, financial conditions were tighter and a trade war had been threatened. Believe it or not, however, the February-April 2018 correction was actually quite typical for a calendar year and why?
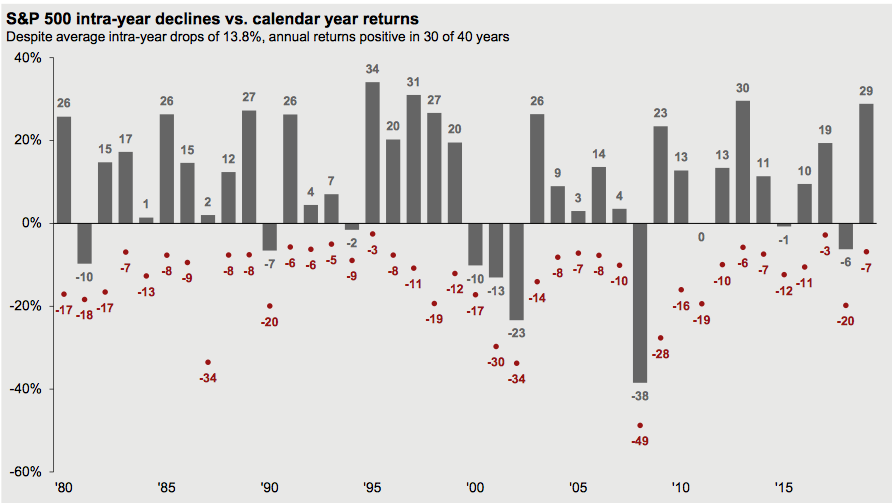
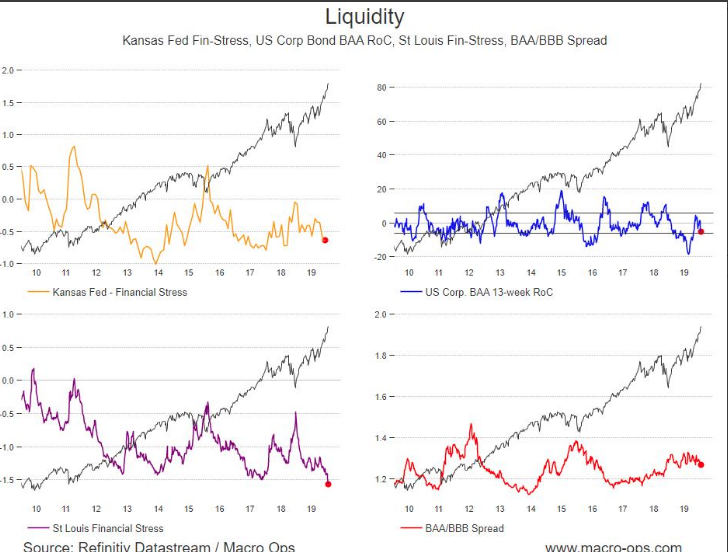
If we travel all the way back to the 1980s, the average intra-year drop is 13.8%, which is pretty close to the drop in 2018 from February until the recovery process in April. This is not the expectation again and given very low rates and an FOMC which is on the sidelines and even expanding its balance sheet. Very different setup! A 5% market correction may be achievable. To reiterate, financial conditions are as flush/loose as can be, the St. Louis Financial Stress index just hit cycle lows, Kansas is low and trending lower, rates remain a tailwind, and the BAA/BBB spread is moving in the right direction. (Charts from Alex Barrow)
Now for some go-forward statistics given present conditions for the S&P 500 that might prove to help guide our capital allocation decisions. The S&P 500 closed above it's 10-DMA for the first 15 days of 2020 (ending on Friday). Looking at the other times it went this far into a new year, the full-year gained 11 of 12 times. The only stinker was 2018, which ended lower.

Again, this speaks to market breadth, fund flows and where the long-term risk/reward is found to be the greatest. Lastly, it also speaks to perceived risk and market volatility. With volatility on the brain, that brings us to the topic of the VIX and how the the "fear gauge" performed through the first 3 weeks of January. Through Thursday of this past week, the VIX Index has averaged a daily close of just 12.9 in 2020, according to DataTrek. That is well below its long run mean, where both annual and just-January averages run 19.1. While it is higher than January 2017 and 2018, it is obviously much lower than January of 2019's average.
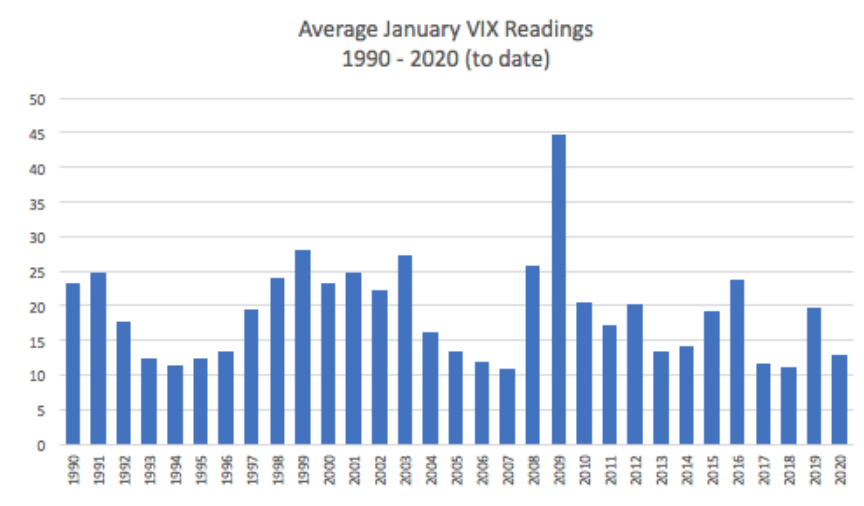
According to DataTrek, here's how the S&P 500 performs across an entire year when January’s CBOE VIX Index average reading is this low (current levels or below), here is that data:
- 1993: +10.0%
- 1994: +1.3%
- 1995: +37.2%
- 2006: +15.6%
- 2007: +5.5%
- 2017: +21.6%
- 2018: -4.3%
- Average: 12.4%
It's clear from the data that low volatility does not indicate doom is lurking and that the market will soon fall asunder. In only one instance (2018) did a sub-13 average VIX reading through January lead to a negative return for the year as a whole.
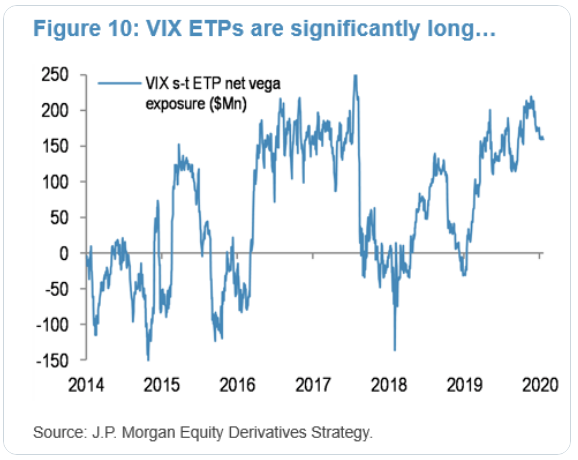
While long VIX ETP VEGA is off of its highs, it is still extreme and presents a headwind for VIX spikes. This is not to suggest that a VIX spike isn't probable, but rather these underwater long positions in ETPs are likely to be shed the closer to break-even prices as they get.
Speaking of the Fed and with respect to my personal outlook in the week ahead...The media was quick and assertive with its bias for the market pullback this past Friday; blame it on the Coronavirus. The reality is that market was looking for any excuse, any excuse at all to work off it's overbought conditions relative to realized earnings growth that is yet to be realized. The Coronavirus headlines became the low-hanging fruit the media can easily grasp onto. Having said that, I would be of the opinion that the Fed's outlined slowing of its balance sheet expansion proved to be one of the more reasonable reasons the market is retreating.
As recently noted by BMO recent notes to clients...
“BMO expects the monthly sizes of $60 billion, or $30 billion post assumed taper, would be composed of both bills and short coupons, ‘helping to reduce expected pressure in the bill market.'”

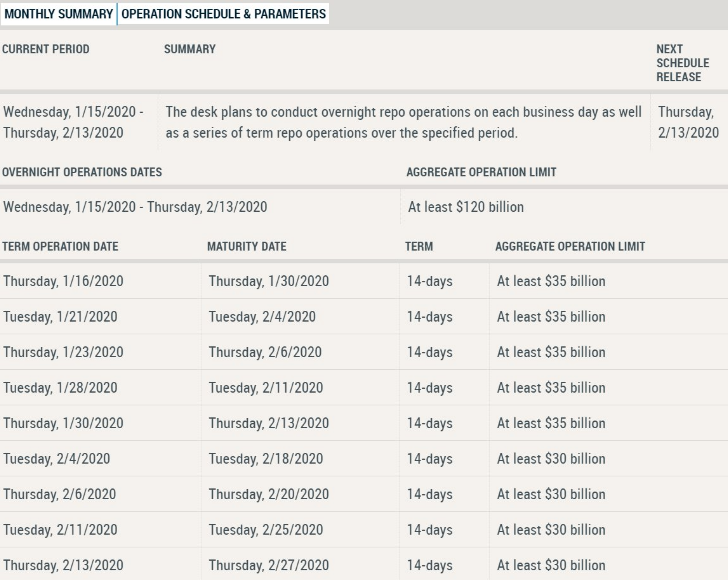
The Fed does indeed expect to convert its short-term bill purchases into longer-term notes to maintain the balance sheet at a higher level. Repo provisions are to be tapered starting 2/4, at a rate of $20Bn/month, based on the table below.
Moreover, the market has already been incorporating this reduction in bond market liquidity, which is playing out in yields moving to the downside and the equity market now looking to accommodate the sentiment shift from the bond market. Liquidity for equities isn't really affected based on slower balance sheet growth, just sentiment.
In the coming days and weeks, investors should anticipate a number of narratives suggesting that any equity market and commodities market decline is tied to the Fed's balance sheet stabilization practices. The narratives will also likely morph into narratives that suggest the bond markets' weakness is now telling the "real story" of a weak economy. None of these narratives are likely to tell the true story, which is one of a normal market correction, should it come to pass, and within the context of an economic expansion cycle.
If the market does one thing best it's climb a wall of worry. Last year it was the yield curve inversion signaling a recession, trade wars and then repo rates followed at the end of the year. Now the market has a new worry and the permabear crowd is wailing about the Coronavirus.
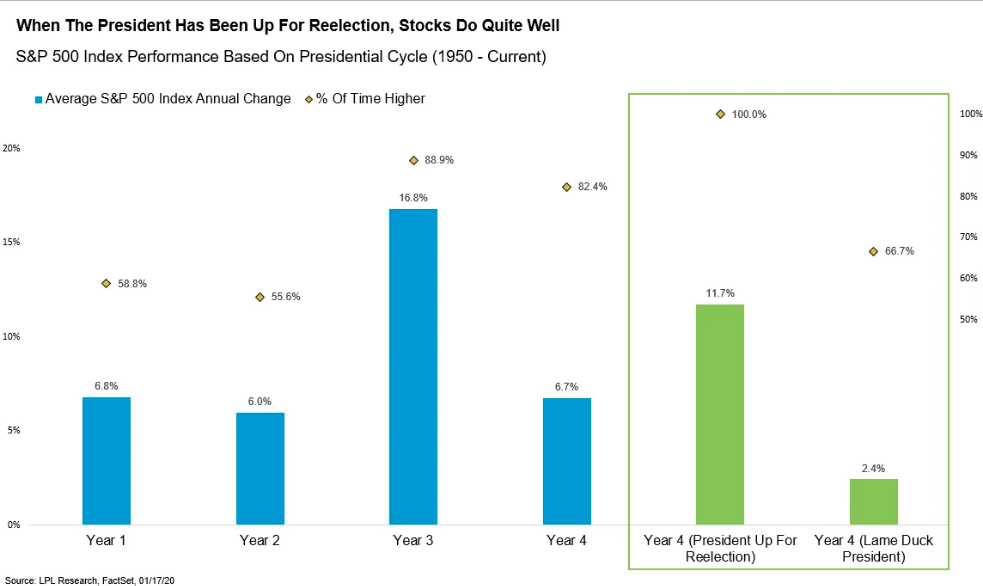
One of the greatest myths offered by permabears and even some analysts concerning the presidential election cycle and markets is that for some reason they promote the uncertainty of the election will breed subpar returns. The reality is that U.S. equities typically perform well in the fourth year of an incumbent’s presidential term. The chart shows the S&P 500 is up an impressive 11.7% on average if the President was running for reelection, compared to up an average of 2.4% if president was a “lame duck president”. (Chart from LPL Research)
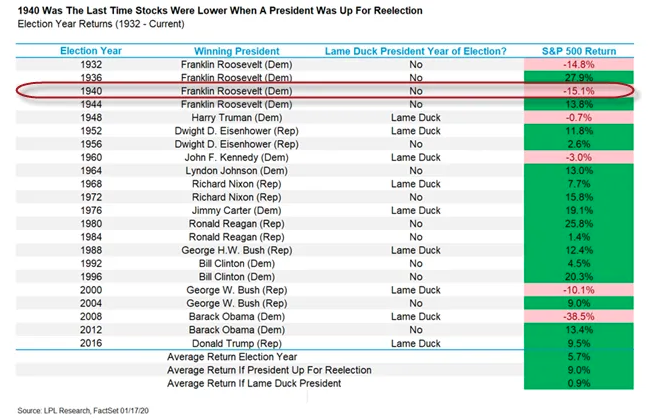
Another encouraging historical trend is that the S&P 500 hasn’t been lower during an election year with an incumbent president up for reelection since 1940. To be clear, stocks have been up during election years when the incumbent president actually lost as well. In 1980, the S&P 500 gained nearly 26%, but Jimmy Carter still lost to Ronald Reagan. In other words, this does support the notion of higher stock prices in 2020.
In closing, investors may find the upcoming week a distressful one for equities, but I remain constructive on the economic and market outlook beyond the coming weeks, months and even first half of 2020. If we recall all the doom and gloom captured by market participants due to the trade war and imposed tariffs at the onset and through much of 2019 that never came to be, now with that tremendous headwind removed to a great degree... Come on, tempt us with lower prices; bring it on! Have a great trading week and trade safely!


