
Will Housing & Economy Recover In 2019?
It’s not just consumer sentiment that declined in early January. Fund managers also became very bearish. The stock market, a leading indicator, began pricing in the risk of a recession in late 2018. However, as it is with all recessions, we only become aware of them in hindsight. It would be easier to say for certain a recession didn’t start in late 2018 if we had the economic data that has been delayed because of the government shutdown, but there’s still enough information to say it’s highly unlikely. For example, the December industrial production report was strong. In the week of January 12th, jobless claims were 213,000 which is only 11,000 above the cycle trough. That’s nowhere close to a recessionary reading.
In a previous article, we used the low forward PE multiple, which quickly increased in January, to show a recession was expected for a short time. Now we have the survey below which shows fund managers were very pessimistic in early January.
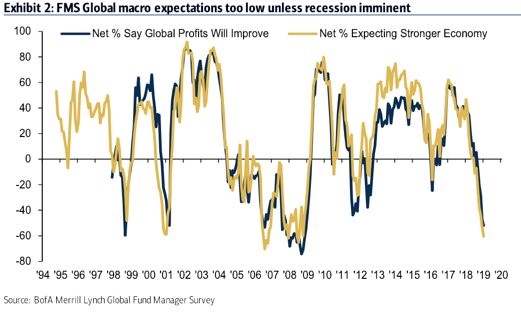
Source: Merrill Lynch
60% of fund managers expected profits and growth to slow in the next year. That’s worse than the trough in 2001 when there was a recession. It’s the worst reading since July 2008 which means it’s worse than the prior 2 slowdowns.
Inflection Point Of What Type?
The fund manager survey below shows the percentage saying they expect a steeper yield curve and the percentage saying they expect a stronger economy.
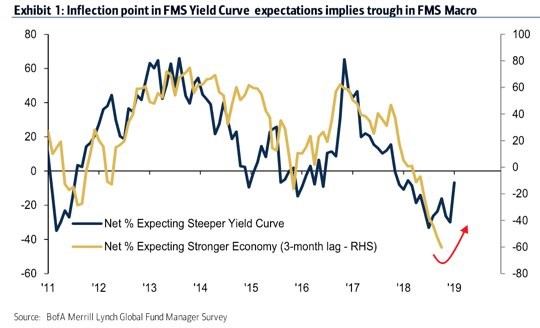
Source: Merrill Lynch
The percentage expecting a steeper yield curve has started to increase. Either this is another example of investors expecting a stronger economy like in 2017 or this is the end of the cycle where the curve inverts and then there is a recession as the curve steepens. The 10 year yield minus the 2 year yield never inverted last fall. The smallest closing difference between the two yields was 11 basis points in early December. There was an intraday low that got to 9 basis points, but the curve still didn’t invert. Some say it doesn’t need to invert for there to be a recession as we reviewed previously.
It’s important to point out that the huge rally in the first 3 weeks of January probably is because some managers have become optimistic. Plus, the rally has probably caused other managers to become bullish. This change could imply the strength in the economy percentage will increase. This could be like in 2006 where managers got too bearish and were simply too early.
Housing Weakness: Could It Reverse?
The housing market didn’t have a great 2018 because of rising interest rates and a lack of affordability. A potential catalyst for an economic growth turnaround in 2019 could be the housing market. Some investors see this as a possibility as the XHB homebuilders ETF increased 14.77% from the Christmas Eve low to January 18th. That would be a big reversal from the weakness seen in the last 2 months of 2018.
The latest data from Redfin in December shows median home prices grew 1.2% to $289,800 as you can see in the chart below. That’s the weakest growth since March 2012. Sales fell 11% which is the worst decline since 2016. Prices fell 7.3% in San Jose. The areas that were once hot are beginning to cool off. Prices in Boston fell 1%; Northeastern cities didn’t have as big of a price increase this cycle as many cities in the West did.
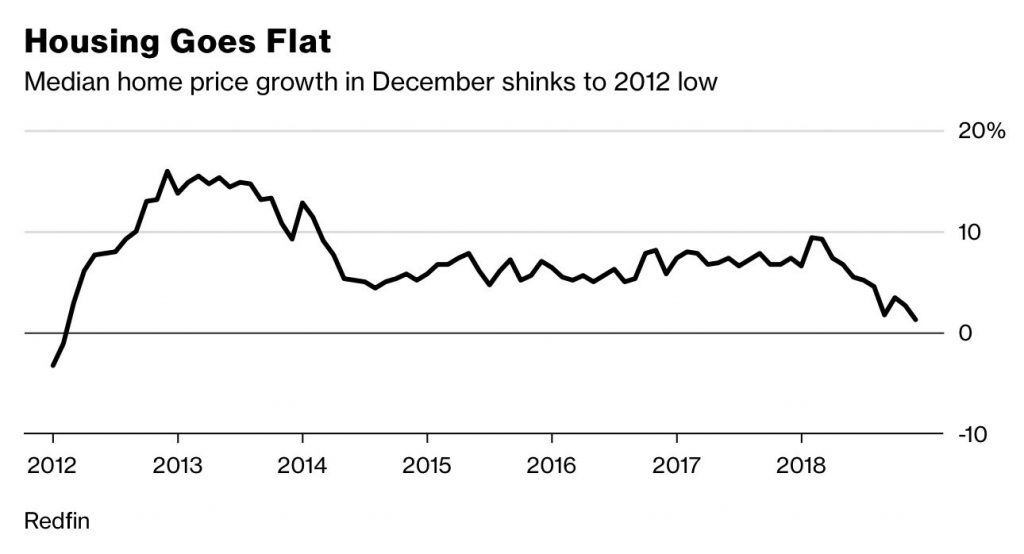
Source: Bloomberg
The homebuilder index was weak, but it showed modest improvement sequentially. A weak report at the cycle bottom which shows improvement is the best possible report in rate of change terms. To be clear, the improvement in the January housing market index from 56 to 58 isn’t enough to call a bottom. As the chart below shows, the current weakness in housing could lead to consumer spending weakness. Any improvement in housing would transform this leading indicator to a positive.
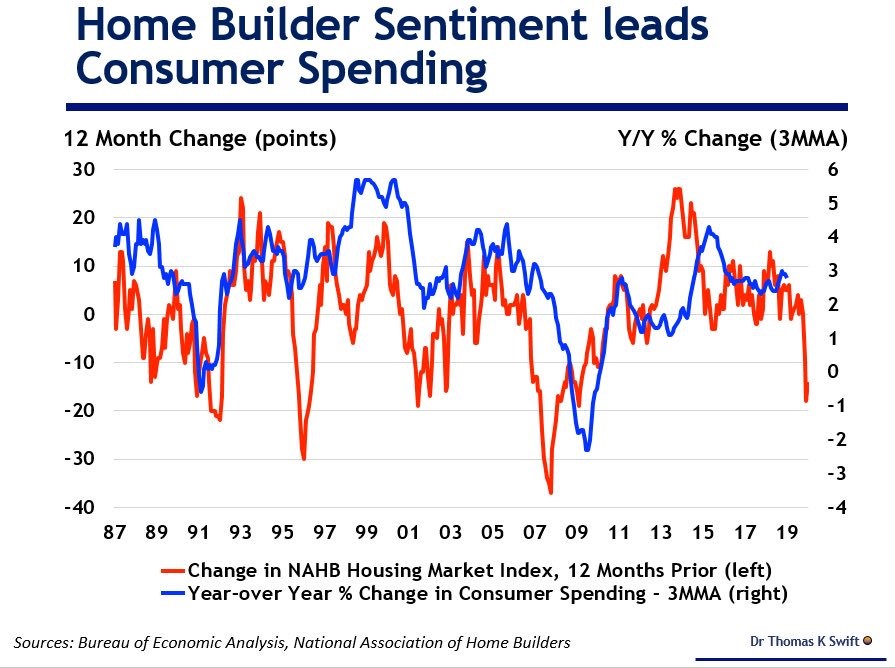
Source: Dr. Thomas K Swift
The increase in the housing market index is the first increase since October and the 2nd increase since May 2018. Specifically, the 6 month sales forecast index increased 3 points to 64. The current sales index increased 2 points to 63. Finally, the traffic index was up 1 point to 44 which is very weak. The West was the strongest index as it was up 5 points to 70. The South, Midwest, and Northeast were at 61,49, and 48. Below 50 is contraction.
The housing market can recover in 2019 because 30 year mortgage rates have fallen from 4.94% in November to 4.45%. Furthermore, the labor market is still strong and real wage growth has increased. The best solution for unaffordable housing prices is slowing price growth. Since there wasn’t a recession, slowing price growth, strong wage growth, and declining interest rates could be enough to turn housing around. Plus, the Fed is pausing its rate hikes.
Improvements were notable in the MBA mortgage applications index from the week of January 11th. The composite index was up 13.5% week over week. That follows a 23.5% increase. The purchase index has been up 17% and 9% in the past two weeks, and the refinance index was up 35% and 19%. Seasonally adjusted mortgage applications reached the highest level since April 2010; unadjusted applications were up 11% year over year. Refinancing applications reached the highest level since March 2018.
Start Of Corrections
The housing data in late 2018 wasn’t good. Don’t let our suggestion that the housing market could improve in 2019 confuse you about the bad November and December data. According to John Burns Real Estate, sales of newly built homes fell 19% year over year in November and 18% in December. Entry-level buyers’ cancellation rate was 18% in December.
Furthermore, according to the National Association of Realtors, December existing home sales fell 6.4% monthly and 10.3% yearly. Median home prices fell 1.4% monthly to $253,600 and were up 2.9% yearly. It’s important to keep in mind the existing home market is much bigger than new home sales. Single-family existing sales were down 5.5% and condo sales were down 12.9%. The Midwest was the worst region as it had a 11.2% decline, and the West was the best as it fell 1.9%.
The chart below shows examples of housing price corrections in various developed markets.
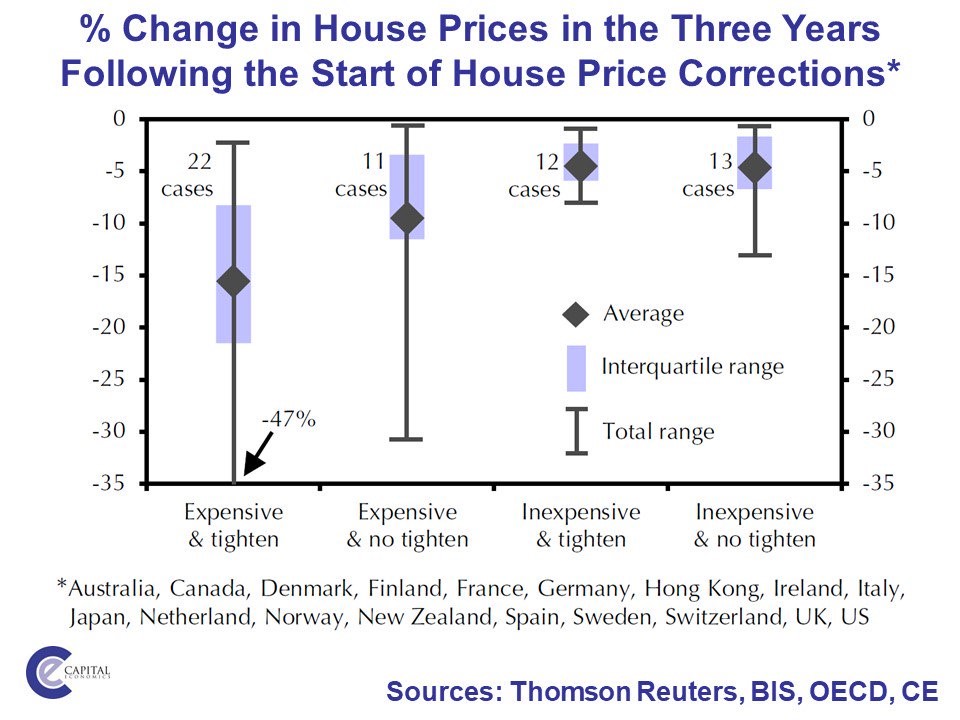
Source: Capital Economics
The worst case scenario is when the housing market is expensive and the central bank tightens. It seems like the Fed won’t be tightening in 2019 based on the futures market; although the Fed has guidance for 2 hikes this year. Whether the housing market is expensive depends on the location. Therefore, the two possible scenarios could be “expensive & no tighten” and “inexpensive & no tighten.” As we mentioned, there may not be a continued correction as activity has rebounded in early January.
Conclusion
There are some early green shoots in 2019. The percentage of fund managers expecting the yield curve to steepen has improved. Since stocks have rallied, it’s safe to say some have become more optimistic about the economy. This is a recovery from extreme bearishness that didn’t lead to a recession as far as we know. The housing market in November and December 2018 was very weak. There might have been a turnaround in January as the MBA applications index has recovered. This recovery would be bolstered by weak housing price growth, strong wage growth, and declining mortgage rates.
Disclaimer: Please familiarize yourself with our full disclaimer here.


