
Will Futures Save Gold?
The extreme bearish CoT positions necessarily imply the turning point in the gold market. Myth or fact? We invite you to read our today’s article about Comex positioning and find out whether futures will save gold.
Usually, the Comex is seen by precious metals investors as the main public enemy. After all, it’s a marketplace for all these short futures which allegedly suppress the gold prices. But now, the gold permabulls use the CoT report as a bullish argument in the discussion on the future of gold.
Why? Let’s look at the chart below. As you can see, the speculators (non-commercials) maintain a very small long position, while the commercial traders are unusually close to being neutral. Although both groups have moderated their bets recently, their positioning is still extreme.
(Click on image to enlarge)
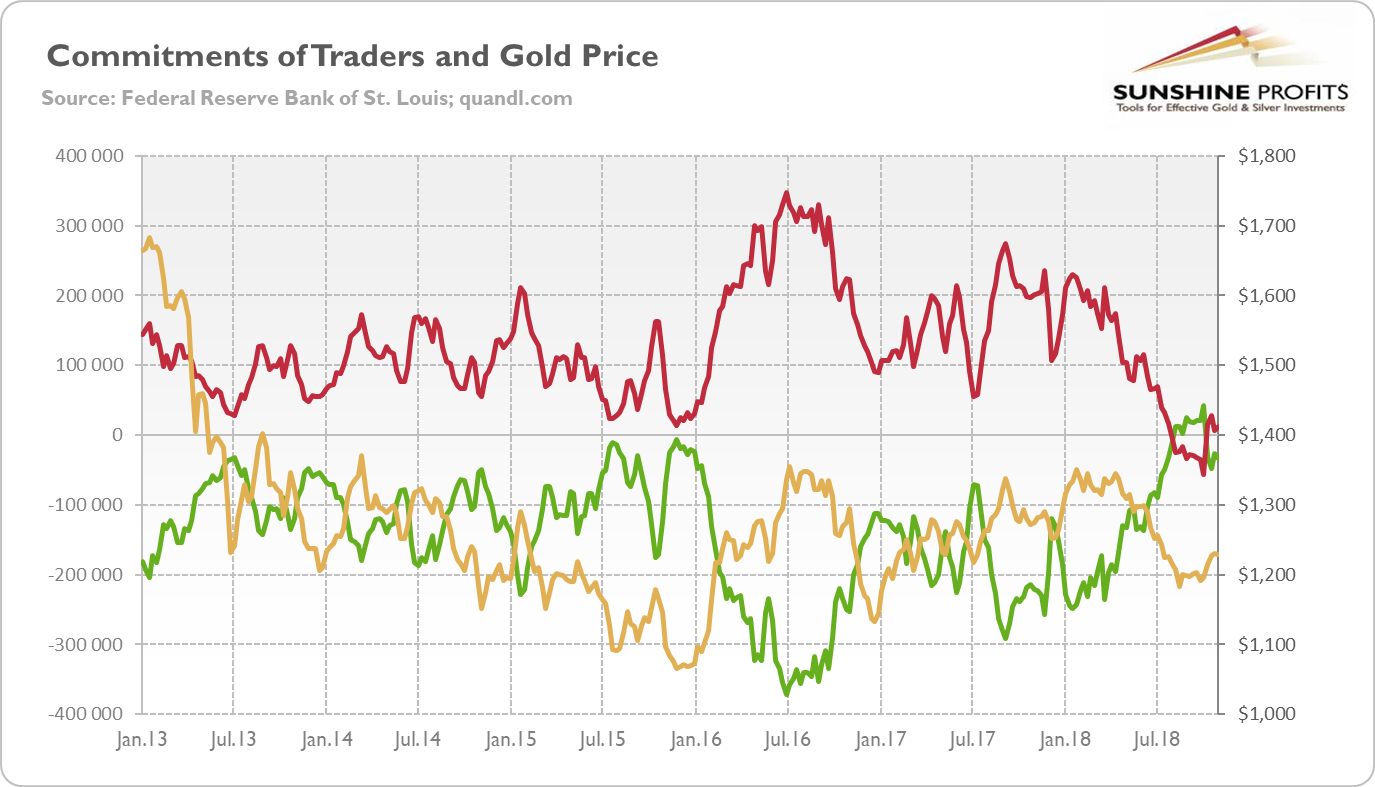
Chart 9: Gold prices (yellow line, right axis, London P.M. fixing, in $), the net position of commercials (green line, left axis) and the net position of non-commercials (red line, left axis) from January 2013 to November 2018 (aggregate version, futures and options combined).
What does it mean? The opinions are divided. Many people point out that speculators are usually most bullish moments prior to significant price tops and most bearish just around the significant price bottoms. Given that speculators are now exceptionally bearish, it might be the case that the price bottom might is close.
Meanwhile, others claim that the current positions are so extreme, that they can’t increase further. Based on this, they conclude that because speculators can’t become more bearish, the price of gold is unlikely to go south.
But it’s a false claim. Speculators can become more bearish as there are no set minimum or maximum levels which cannot be exceeded (without a price reversal). And they did: speculators were consistently net short in the period of 1996-2001, as the chart below shows!
(Click on image to enlarge)
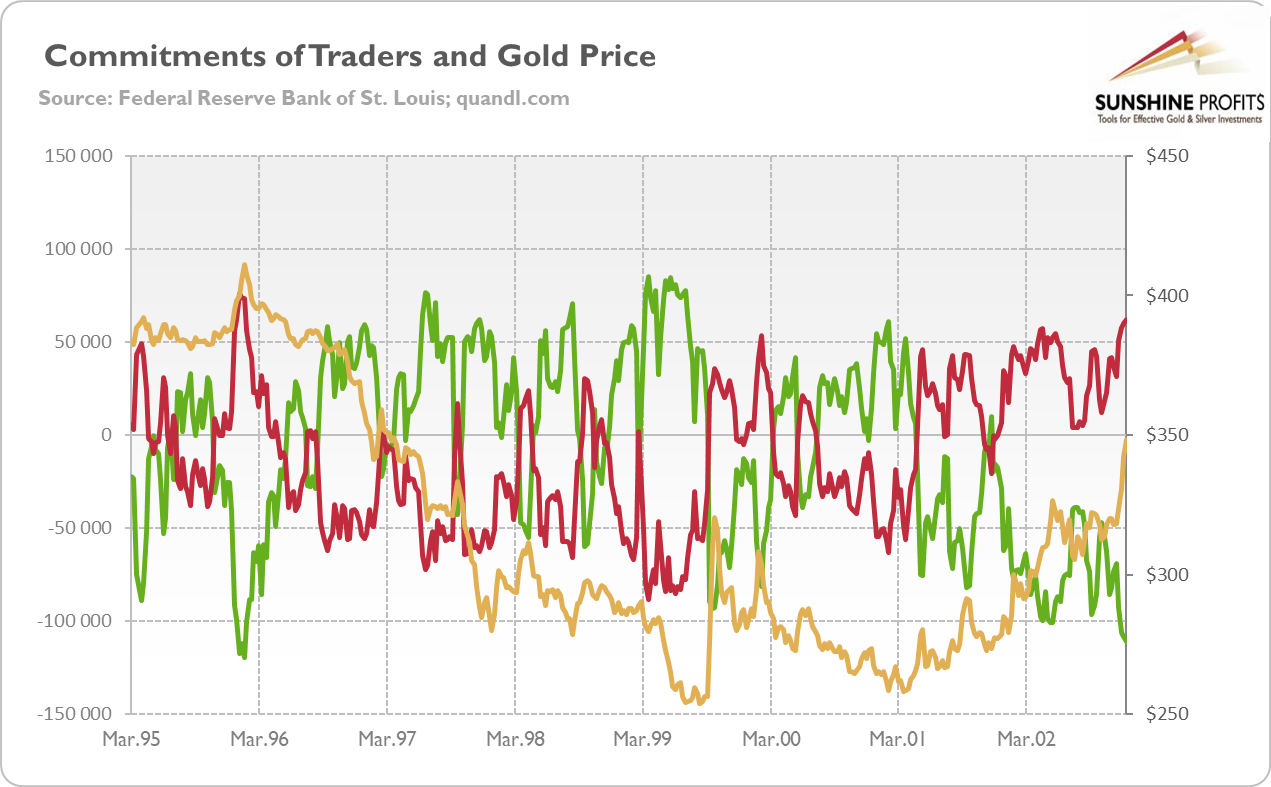
Chart 10: Gold prices (yellow line, right axis, London P.M. fixing, in $), the net position of commercials (green line, left axis) and the net position of non-commercials (red line, left axis) from March 1995 to December 2002 (aggregate version, futures and options combined).
You see, the CoT is a widely misunderstood report. First of all, people forget that each futures contract has two sides. It means that the gold futures market cannot be short or long as a whole. So the bearish non-commercials accompany the bullish commercials.
Second, the CoT positioning is not a timing indicator. It may indicate a market sentiment, but the sentiment is actually shaped by prices. When they go up, speculators get excited and increase their long positions. When they drop, non-commercials worry and cut their positions. As a consequence, they buy at the top and sell at the bottom.
Hence, when the bottom arrives, it will surprise speculators waiting for the worst. But we are unable to draw any conclusions about the timing of the turning point on the basis of the positioning. The extreme positions could get even more extreme instead of being reversed. The same with promotions: when you get it, your salary jumps. But you cannot predict a promotion just by looking at your bank account, can you?
Third, the CoT positioning shows the number of outstanding futures contracts for gold. So, basically, it is a volume indicator, which indicates how much gold is traded in the US futures market. But it does not say where prices are heading – the price of gold can increase or decrease with both low and high trading volume.
Last but not least, what we understand as extreme pessimism or optimism is constantly evolving. The futures market is larger and more volatile than in the past, which weakens the signaling power of the CoT positioning. The CoT trading system had some interesting implications and it pinpointed many turnarounds more than 10 years ago, but the development of the futures market (just look at the increased volume) made the CoT-based signals too inaccurate to be viewed as important.
The key takeaway is that the CoT report might be a useful tool in gold investing, but we read too much into it. It reveals much less than it is commonly believed. The open interest shows the volume, while the commercials and non-commercial positioning may indicate the market sentiment, but it does not automatically determine the most likely price direction.
The press loves to comment on the record shorts or longs and the imminent reversal in gold prices, but a lot of these records did not precede a material correction in gold (as the charts above show). Abstracting from the evolving character of the ‘extreme positions’, the reason for that is that prices are not only shaped by the market sentiment, but they also do shape the market sentiment.
Hence, do not base your expectations on the idea that the price of gold has to start a rally soon on the extreme bearish positioning of the non-commercials. People who did this in 1996 had to wait five years for the start of the bull market, witnessing several successive ‘record positioning’. Do not be like them!
If you enjoyed the above analysis and would you like to know more about the most important macroeconomic factors influencing the U.S. dollar value and the price of gold, we invite you to read the ...
more

