
Why This Mini Meltdown Could Get Worse
The Bear is on the Prowl
Wednesday was officially the worst trading day of 2021, and the single worst trading session since October 2020.

So, was this just a one-day event, or is the selling likely to persist?

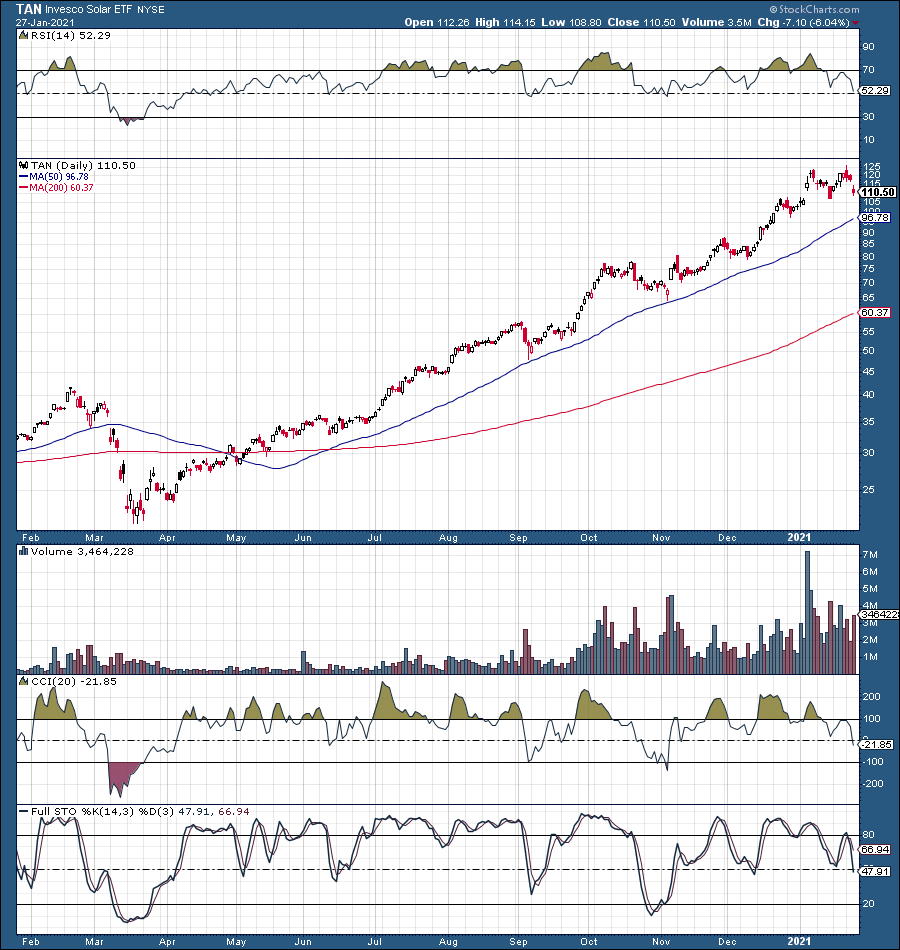
Source: StockCharts.com
Well, let's attempt to pin down the reasons for the decline. The first and foremost catalyst that comes to mind right away is slower than anticipated growth. Earlier, we spoke about news out of Germany and other countries announcing slower than expected economic growth projections.
For instance, Germany recently cut its 2021 GDP growth forecasts to 3% from a previous estimate of around 4.4%. This is quite the drop and suggests that the COVID-19 pandemic is causing more systemic damage to the global economy than was expected. In fact, the prospects for a V-shaped bounce back don't appear all that realistic anymore. This was further reinforced by the Fed's remarks on the economy and the slower than expected growth path to recovery Wednesday.
The Technicals are Another Problem
We talked about technicals being a problem in pre-market yesterday. Primarily we discussed the VIX and the RSI divergences.
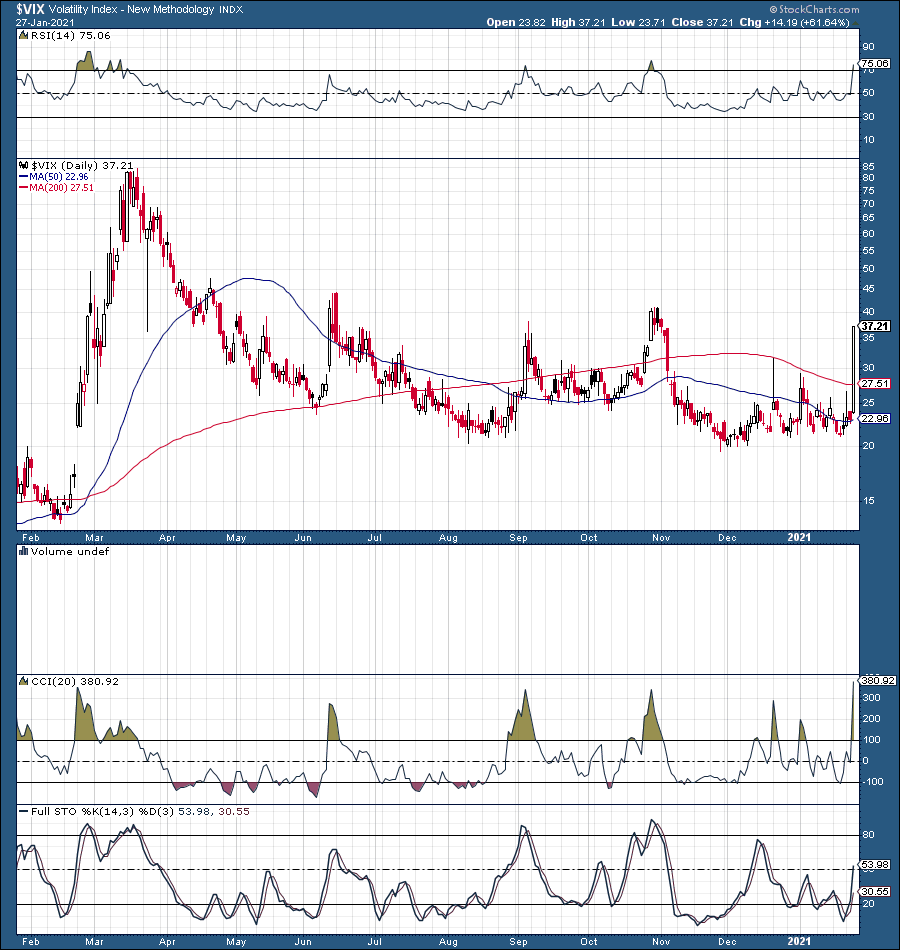
The fact that the VIX hit a low of about 20 around two months ago, but the S&P 500/SPX (SPX) kept moving higher and higher led to a clear divergence in recent weeks. In fact, the VIX was about 20% off its lows by Wednesday, but the SPX was around ATHs or roughly 6% above where it was back at the start of December.
When we see the SPX and the VIX both moving higher for an extended period of time, it raises concern and is typically a prelude to a pullback/correction in stocks. This phenomenon implies that traders are increasing options purchases. On the one hand, we likely have increased call buyers chasing performance, and on the other hand, we likely have "smart money" purchasing put options to hedge existing positions.
Then there's the RSI divergence
This is present, but is not as pronounced in SPX and other major market averages, as it's in some of the sky high flying segments like solar/alternative energy, lithium, and other frothy segments.
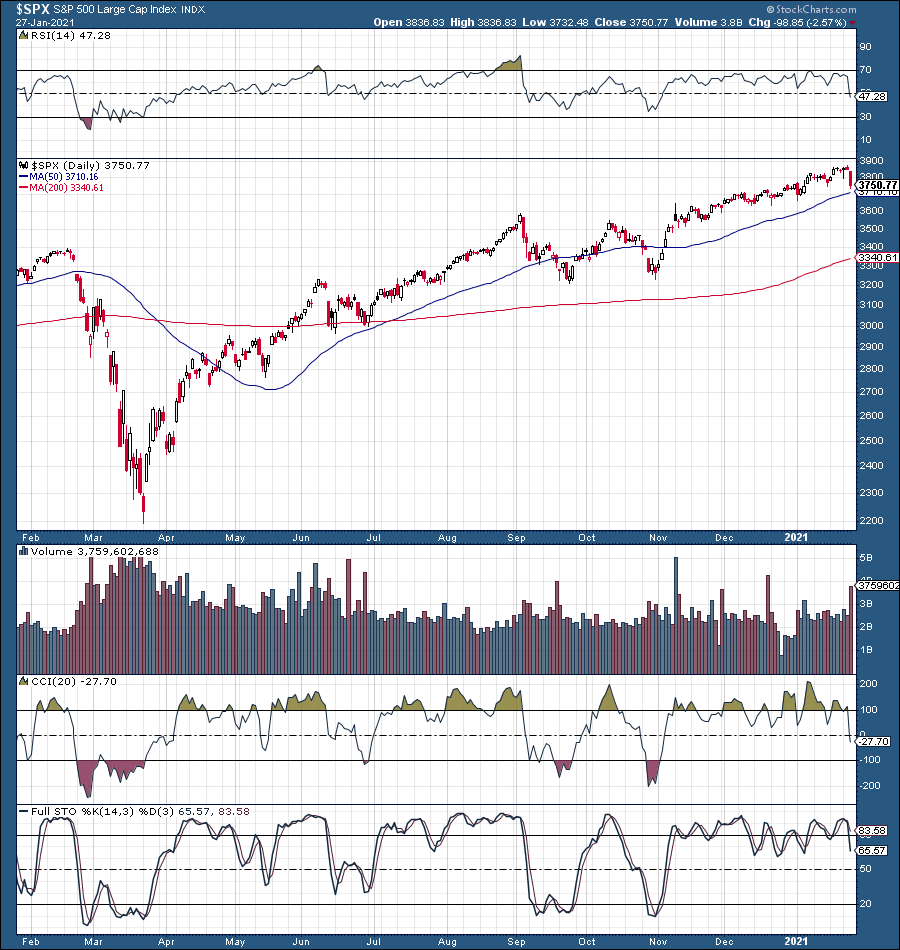
Slight RSI divergence
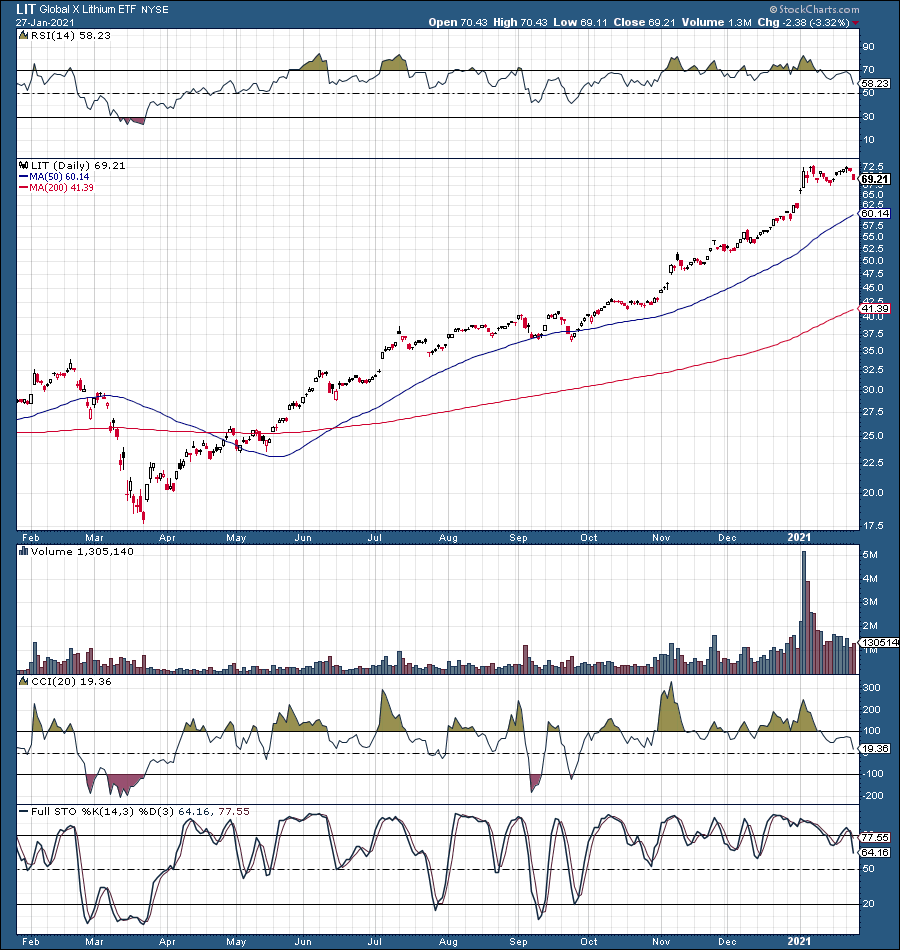
Pronounced RSI divergence
Also clear RSI divergence
The RSI divergence is when we see the RSI peak at a lower price point relative to its latest high. We can see this quite clearly in many stocks, ETFs, even major market averages. This divergence implies that momentum is weakening, and that fewer buyers are bidding up certain areas in the market. This typically leads to a shift in momentum as the market essentially runs out of buyers, and sellers start to control price action.
Wild Things Are Happening
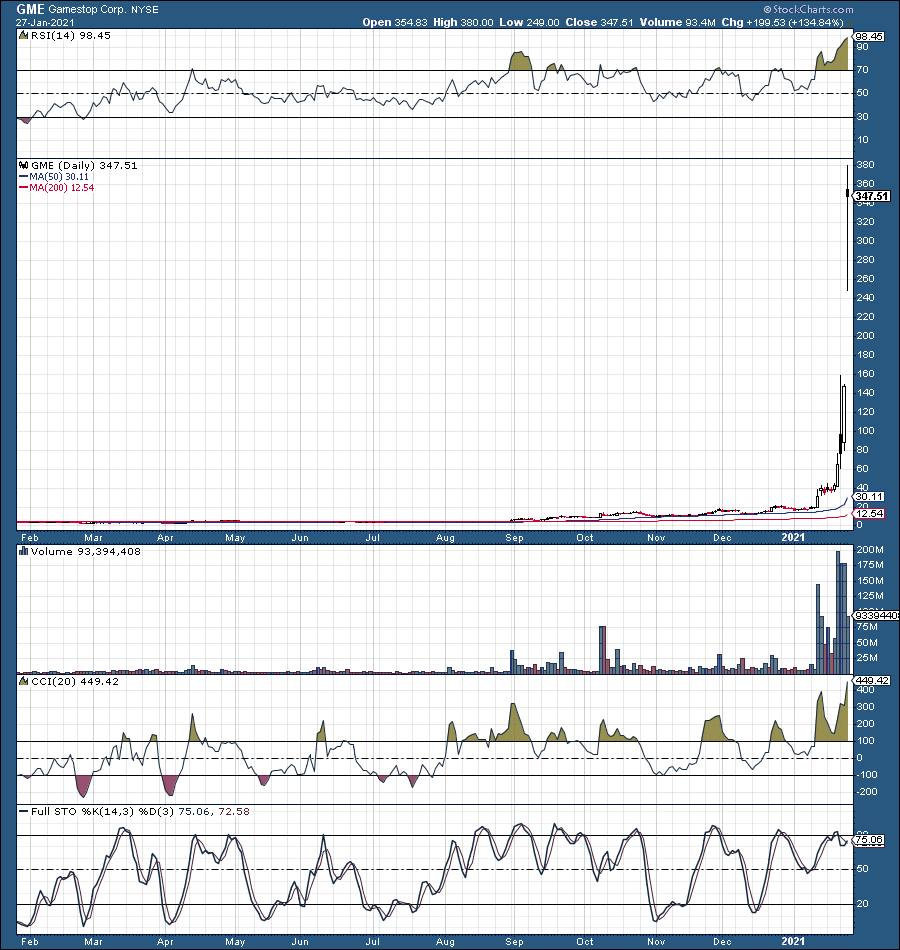
Another sign that the market may be ready for a break is some extremely atypical phenomenon. I'm sure that just about everyone has heard of GameStop (GME) by now. Remarkably, shares were around $3-4 roughly a year ago. Well, now they are trading at around 100 times that.
Yes, 100 times that
Why you may ask...
GameStop is a stock that was heavily shorted, and possibly it was undervalued at some point. I don't think $3-4 is a fair valuation for GME, but perhaps $10-20 is. So, how is it that this stock is approaching $400? It appears that a group of "retail" investors identified this stock as a concentrated stronghold for short sellers and decided to orchestrate a short squeeze. Then the retail investors proceeded to implement social media platforms to essentially pool their resources and coordinate the attack.
Well, it worked, and this is nothing like I have ever seen in my 20 years of investing. I don't think that even the participants expected the results that we witnessed. As excess liquidity flowed into GameStop shares, it unleashed one of the greatest and possibly the most irrational short squeeze in stock market history. As a flurry of institutional investors rushed to cover their positions, the combined effect of shorts running for the doors and extremely high amounts of liquidity entering the stock fueled shares to skyrocket. The stock is currently up by close to 9,000% over the past year.
Is this justified?
Should GME shares be worth $350? No, of course not, in my view. The most this stock has ever been worth was around $60 in the run-up to the financial crisis of 2008. That was in the company's heyday, whereas now the company is losing money hand over fist and is essentially straggling to survive. Yet, its stock is trading at 5X its previous ATH. This is about as logical and as sustainable as negative $40 oil we saw briefly during the mid-March bottom in 2020.
GameStop is Not Alone
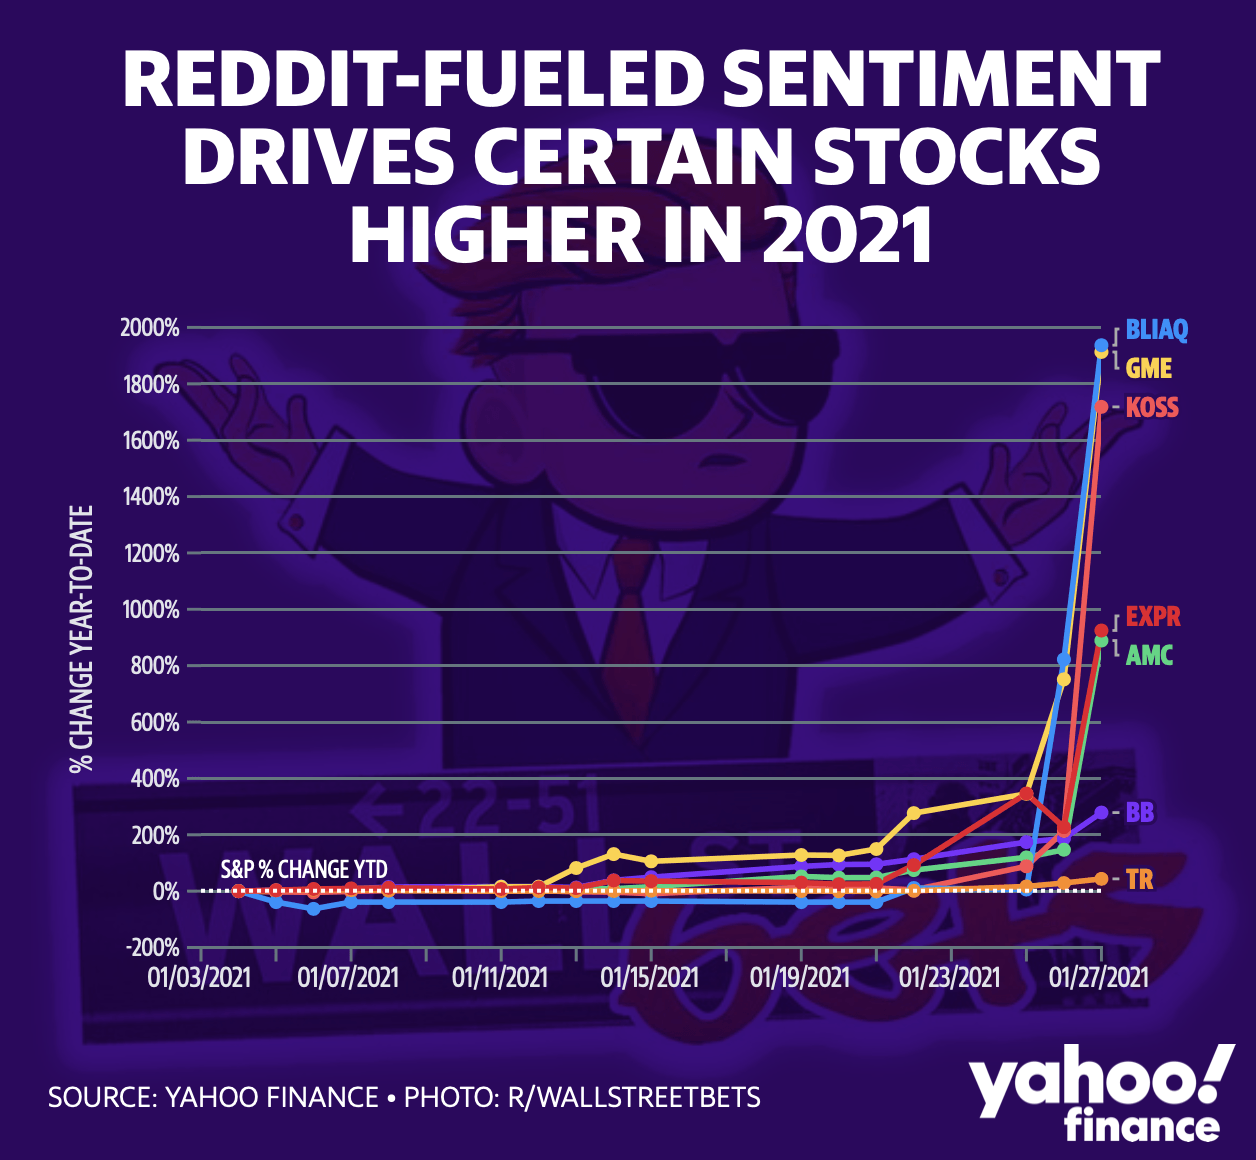
Source: finance.Yahoo.com
Along with GME, we see such gems like AMC Entertainment Holdings (AMC), BlackBerry (BB), Koss Corp. (KOSS), Bed Bath & Beyond (BBBY), Express Inc. (EXPR), and others surging by remarkable percentage points, some quadrupling or more in value in a single trading day.
The Bottom Line: Where Markets are Likely Headed Next
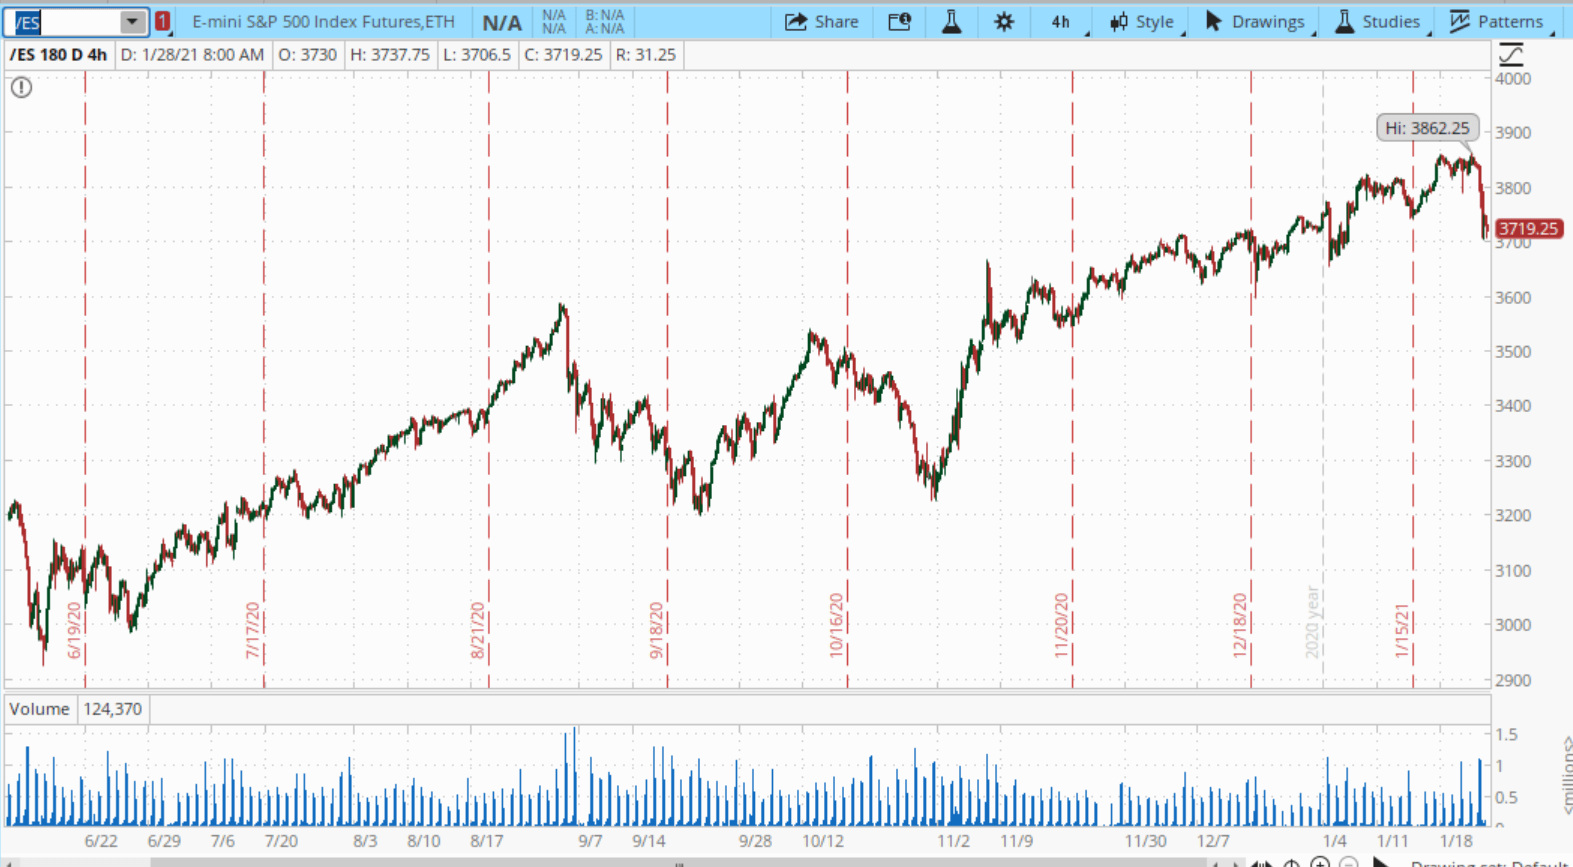
Source: Think or Swim, Ameritrade
So far, the pullback in SPX futures has been around 3.7%. The bad news is that it's unlikely that the selling will subside just yet. The good news is that we could be around halfway done with the pullback. Technically, there are several scenarios that could play out from here.
1. The Best Case - Naturally, the best case would be for selling to desist today, and for markets to move to new ATHs from here. However, while plausible, I don't think this is the likeliest scenario, and I give it around a 20% probability of playing out.
2. The Base Case - The base, and most probable case in my view, would be to see a pullback to around the 3,600 level. This would equate to a correction/pullback of roughly 7%. Not too deep, not too shallow, just right in my view. This scenario has about a 40% probability of materializing in my view.
3. A Worse Case - In a worse-case scenario, which also is quite plausible in my view, SPX could pull back a bit further, to roughly 3,500 support, resulting in a textbook correction of 10%. I give this scenario a probability of roughly 30%.
4. The Worst Case - The worst-case scenario could occur if key 3,500 support got taken out. In this case, we could possibly see SPX decline to 3,200 support or even back down to the 3,000 area. This would be a deep "correction" of 17%-22%. However, this scenario is relatively remote in my view, and I give it only about a 10% probability of materializing.
Disclosure: I/we have no positions in any stocks mentioned, and no plans to initiate any positions within the next 72 hours.
Disclaimer: This article expresses solely my opinions, is ...
more

