
Why Energy-Economy Models Produce Overly Optimistic Indications
I was asked to give a talk to a committee of actuaries who are concerned about modeling the financial future of programs, such as pension plans, given the energy problems that are often discussed. They (and the consultants that they hire) have been using an approach that puts problems far off into the future. I was trying to explain why the approach that they were using didn’t really make sense.
Below are the slides I used, and a little explanation. A PDF of my presentation can be downloaded at this link: The Mirror Image Problem.

FCAS stands for “Fellow of the Casualty Actuarial Society”; MAAA stands for “Member of the American Academy of Actuaries.” Actuaries tend not to be interested in academic degrees.
I try to explain how a more complex situation can be hidden in plain sight.

It is not obvious that both the needs of energy producers and energy consumers should be considered.
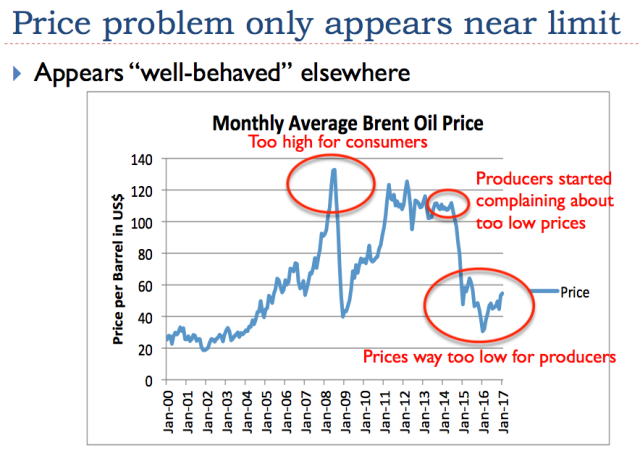
If we look back at what the discussions of the time were, we can see when remarks were that prices were too high for consumers, and when they were too low for producers. See for example my article, Oil Supply Limits and the Continuing Financial Crisis and my post, Beginning of the End? Oil Companies Cut Back on Spending. This latter article shows that companies were already cutting back on spending in 2013, when prices appeared to be high, because even at a $100+ per barrel level, they still were not high enough for producers.

Oil companies tend to extract the cheapest and easiest to extract oil first. Eventually, they find that they need to move on to more expensive to extract fields–even with technology enhancements, costs are rising. There seems to have been a step up in costs starting about the year 2000. The above chart is by Steve Kopits. This EIA data (in its Figure 10) also shows a pattern of sharply rising costs about the same time.
The problem, of course, is that wages have not been spiking in the same pattern. As a result, we encounter the problem of prices being either too high for consumers, or too low for producers, as we saw on Slide 4.
The economy is “built up” from many different parts. It includes governments, businesses, and consumers. It also includes people with jobs in the economy, and individuals and businesses making investments in the economy. It gradually changes over time, as new businesses and new laws are added, and as other changes are made. The wages that workers earn influence how much they can spend. The economy keeps re-optimizing, based on the goods and services available at a given time. Thus, slide rules are no longer commonly sold; it is not easy to buy horse-drawn carriages. This is why I show the economy as hollow.
Let’s talk a little about how economic growth occurs in a networked economy.

Clearly, tools and technology can be very helpful to creating economic growth. I am using the term “tools” very broadly, to include any kind of structure or device we build to aid the economy. This would even include roads.

Making tools clearly requires energy. Operating these tools very often requires energy as well, such as energy provided by diesel or electricity. With the use of tools, humans can more efficiently make goods and services. For example, if small parts need to be transported to a business, it is nearly always more efficient to transport them by truck than to deliver the parts by walking and carrying these parts in our hands. Clearly, tools such as trucks also allow us to do things that we could never do otherwise, such as deliver large and heavy parts to users.
Economists often talk about “rising worker productivity,” as if this rising productivity came about because of actions undertaken by the worker–perhaps attempting to work faster. Another possibility would seem to be taking a course on how to work more efficiently. We would expect that most of the time this rising productivity would come about as a result of the use of additional tools, or better tools. Thus, it is really the tools, and the energy that they use, that are acting to leverage worker productivity.

It is not intuitive that adding tools requires debt, unless a person stops to realize that it generally takes quite a bit of resources to make a tool (human labor, plus metal ores and energy products). Using these tools will provide a benefit over quite a long period in the future. A business making these tools has a problem: it must buy the resources to make the tools and pay the workers, before the benefit of the tools actually comes into existence. It is necessary to have debt (or a debt-like financial instrument, such as shares of stock), to bridge this gap.
This same kind of mismatch occurs, even if goods being purchased with debt are not really tools. For example, a home purchased with debt and paid for with a mortgage is not really a tool. The buyer needs to pay interest to a bank or some other intermediary, in order to finance the home over a period of years. Thus, part of the worker’s wages is going to the financial system, rather than to obtain the goods and services he really wants. Financing the home with debt is generally more convenient than paying cash, however. Because of the convenience factor, debt is generally essential for most home purchases. If a new home is being purchased, the builder who builds the home will need to buy lumber and pay workers when the house is built, rather than over the lifetime of the house. Because of this, debt is necessary so that the builder will have the funds to buy lumber and pay the workers.
Analysts coming from engineering and other “hard sciences” often miss this need for debt. Since a person can’t see or touch it, it is easy to think it isn’t needed. Interest payments are important, because they transfer goods and services made by the economy away from workers to other sectors of the economy (such as the financial system, retirees, and pension programs). Thus, they represent a different use for energy products, other than making goods for the use of workers.

Slide 11 shows how an economy produces a growing quantity of goods and services. The three types of inputs I show are
- Energy products and other resources
- Workers
- Tools
I perhaps should include government services, such a roads, as well. If I did, I would show a fourth box down the side. Such a box didn’t fit easily on the slide, so I left it off.

As I noted in Slide 10, it takes debt to be able to have enough funds to pay everyone who makes tools, and in fact, other goods (such as vehicles and homes) that we pay for over the life of the goods. In Figure 12, I show that at least some of those providing inputs to the process receive “Future goods and services, plus interest,” rather than goods that have already been made. In this way, the system distributes more goods and services than would be available through the barter system.
In my notes to Slide 11, I commented that I perhaps should have included a government sector, as a fourth box down the side. That comment is also true here. On Slide 12, we are distributing the benefit of goods and services created, so we probably need to add even more boxes down the side. One of them would be “Payments Under Funded Pension Programs.” Another box would represent payments to individuals who sell appreciated shares of stock and real estate, and hope to buy goods and services with the proceeds of these sales. In the government sector, we would need to be certain that the category is large enough to include goods and services distributed to retiring “Baby Boomers” under Social Security and similar unfunded retirement programs.
People who do modeling can easily lose sight of the fact that we really live in a “calendar year” world. Each year, we can extract only so much oil, coal, gas, and metal ores, and use those resources to make goods and services. These goods and services are generally available for sale the same year. It is easy to add layers and layers of promises of “future goods and services” to the system, without ever checking to see whether the resource base provides enough resources to make promised future distributions of goods and services possible.
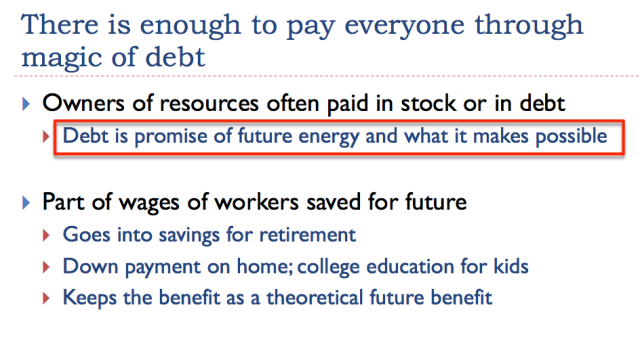
Often, it is the owners of resources who are paid in stock or debt. Workers are paid in money (which is a form of debt), but they very often want to spend most of it on goods and services that they can use today.
We can think of debt (and balances in bank accounts) as promises for future energy, and the goods it makes possible. Of course, if that energy isn’t really available, the promise is an empty promise.

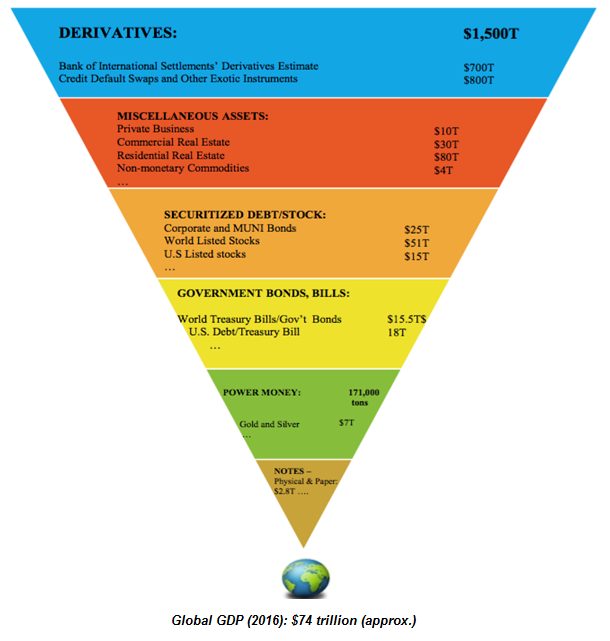
There are many kinds of debt, and reciprocal obligations. This is a chart I found recently, giving one person’s view of the amount outstanding today, including a very large amount of derivatives. All of these debts make the assumption that energy will be available in the future so that goods and services can be created to fulfill these various types of promises.
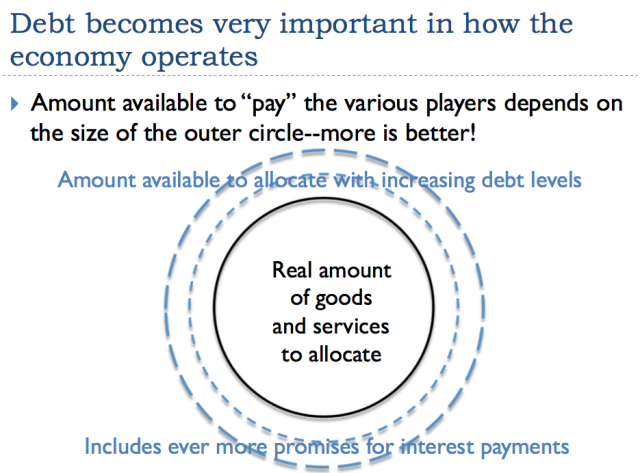
Debt becomes very important in the whole system, because the higher the debt level, the higher that wages can be. Also, with a higher debt level, commodity prices, such as oil prices, can also be higher. Because more debt seems to make almost everyone richer, governments go out of their way to encourage additional debt, and more debt-like instruments. Of course, if interest rates go up, rather than down, interest on this debt becomes a big burden for borrowers. On Slide 12, the higher interest rates transfer a larger share of goods and services away from workers to other sectors of the economy (such as pensions).
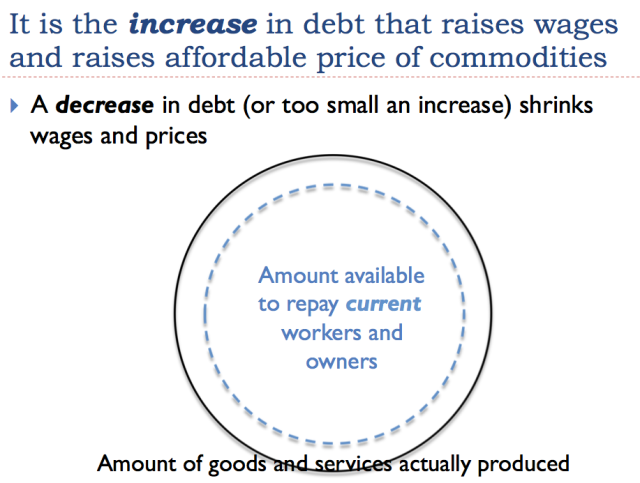
Shrinking debt levels are similar to governmental cutbacks for programs. (In fact, governmental cutbacks in programs often result from shrinking debt levels.) Then fewer workers can be hired, and fewer goods and services can be purchased. The economy tends to shrink–similar to what happened during the 2008-2009 recession.
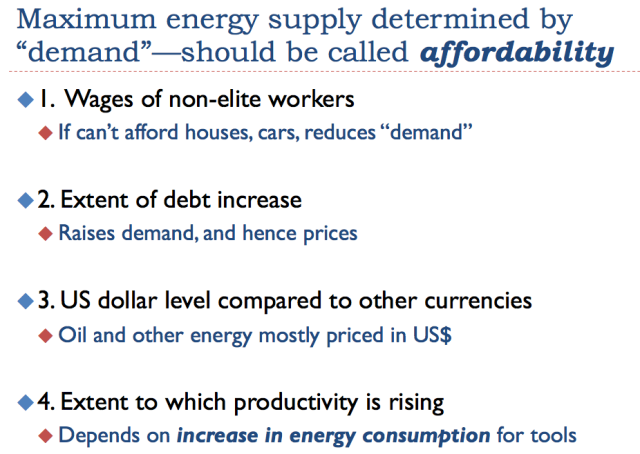
We often hear about “Supply and Demand.” A better name for “demand” might be “amount affordable.”
I mentioned in previous slides that wages and the amount of debt increase are important in determining the amount affordable. Other items that have a bearing are Item (3) the level of the dollar relative to other currencies, and Item (4) the extent to which productivity is rising. If the dollar is high relative to other currencies, the price of oil tends to be low, because those buying goods made with oil in non-US dollar currencies find the goods expensive.

Slide 18 illustrates the very significant impact that changing interest/debt levels can have on oil prices. Although I don’t mark the point on the graph, the peak in oil prices in 2008 came when US debt levels on consumer loans and mortgages started to fall. (See Oil Supply Limits and the Continuing Financial Crisis for details.) The US began Quantitative Easing (QE) in late 2008, with the intent of lowering interest rates and making debt more available. It was not long after it began that oil prices began to rise. Once QE was discontinued in 2014, other currencies fell relative to the US dollar, and the price of oil again fell.
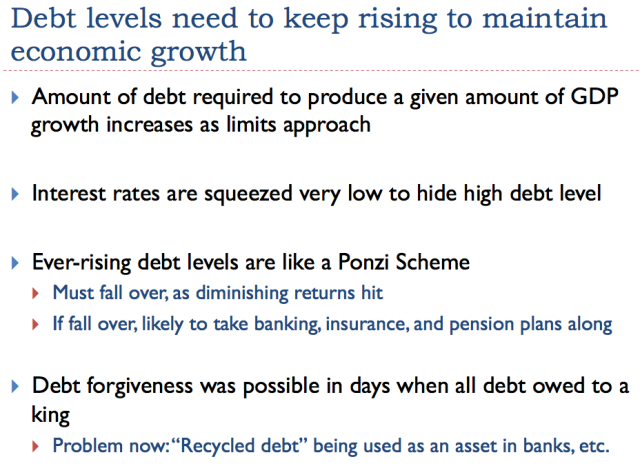
The situation we have now is very much like a Ponzi Scheme. We need to keep adding more debt to keep wages and commodity prices high enough. At the same time, interest rates need to stay very low, to keep payments manageable, and keep the whole system from collapsing.
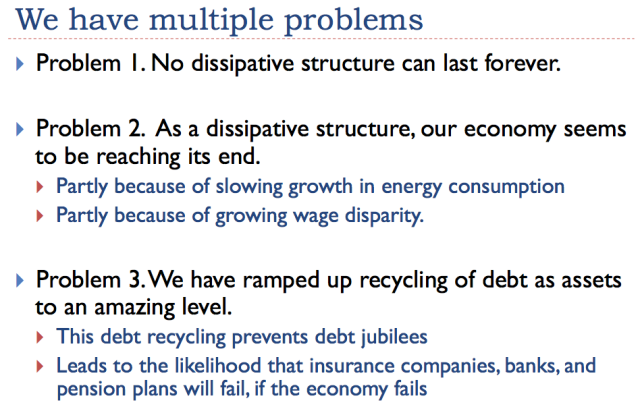
The balance sheets of insurance companies, banks, and pension plans include much debt. If these institutions are to make good on their promises to those with bank accounts, insurance policies, and pension plans, it is necessary for this debt to be repaid with interest. Back many years ago, debt jubilees were often given to selected debtors. These are out of the question now, because banks, insurance companies, and pension plans depend upon the future payments that this debt represents.

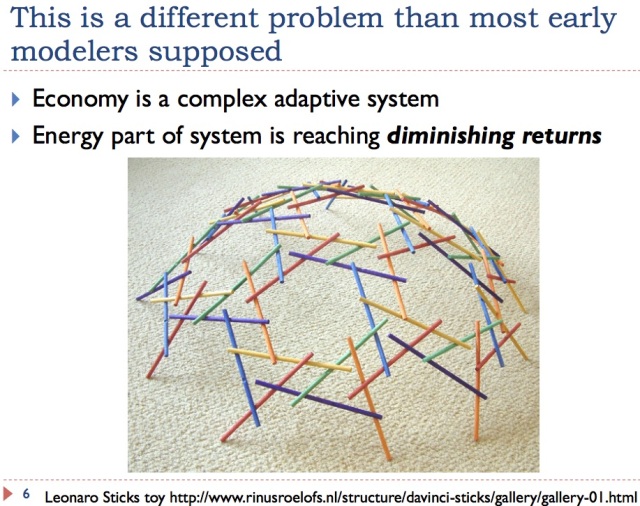
We like to think that improved technology can add more and more benefit. In fact, technology seems to reach diminishing returns, just as almost any other type of investment does. We make the easy changes (smaller cars, for example) first. Later changes tend to be more incremental. Because of this pattern, we can’t count on huge future changes in technology saving us.

Most people do not realize that the laws of physics determine the way that markets work–for example, the prices at which sales take place, and whether or not there are enough suppliers of a given product in the market place. They assume that as we reach limits, markets will always work as they have in the past. This seems unlikely.

Physics is often taught in terms of what actions are expected in an “isolated” or a “closed” system. In fact, the earth receives energy from the sun. The economy also obtains energy from stored fossil fuels and from uranium. Because of these energy flows, the rules of an “open” system are more appropriate. These have only been studied in recent years. Ilya Prigogine received a Nobel Prize in 1977 for his work on dissipative structures.
What is surprising is that dissipative structures are always temporary. They grow for a time, but eventually collapse. While we know that plants and animals have finite lifespans; generally new similar plants and animals replace them. It is less obvious that systems such as ecosystems and economies have finite lifetimes.

Figure 23 shows my idea of how the dissipative structure of an ecosystem might be represented. Its inputs include solar energy, water, air, minerals from the soil, and recycled waste products from plants and animals. There are no real waste products from the system, because waste products are recycled. Ecosystems tend to collapse, when very sharp fluctuations occur. For example, forest fires tend to occur when a large amount of waste wood has accumulated and weather conditions are dry. (Perhaps dry wood and leaves, if they do not degrade rapidly enough, might be considered a temporary waste output that can lead to the demise of the ecosystem through fire, when conditions are right.)

Figure 24 shows my idea of how the economy might be represented as a dissipative structure. One critical part is “other energy,” which makes the economy act much like a rocket. Another critical part of the economy is “tools and technology.” Tools and technology allow the various inputs to be used, and the economy to grow. In a way, they are parallel to the biological systems that allow plants and animals to grow in ecosystems.
With human economies, we have multiple problems that can occur:
[1] Quantity of resources needed for inputs falls short
[2] Population of humans rises disproportionately to inputs of energy and other resources
[3] Waste outputs of various types become a problem
Growing debt is one of the waste outputs. Since we voluntarily seek out debt, we think of debt as an input. But if we think about the situation, debt is really is an adverse output. Required interest payments tend to pull funds out of the system that could otherwise be used to pay workers. Also, the rising use of debt tends to concentrate the ownership of “tools” among the already wealthy. Debt can grow for a while, but it has limits, because of the adverse impacts it creates for the economy.
Growing wage disparity occurs because of the increased specialization required by ever-rising use of tools and technology. Some people receive the benefit of advanced education and learning to use tools such as computers; others receive much less benefit. As a result, their wages lag behind. Wage disparity is another limit of the system. If a large share of the workers cannot afford to buy the output of the economy, “demand” falls too low, and commodity prices tend to fall.
Distorted prices (shown on Slide 24) have to do with the changes to prices that occur, both because of added debt, and because we are reaching limits. Prices are not the same as they would be in a pure barter economy. Added debt allows prices to be much higher. As we reach limits, prices can fall below the cost of production. Suppliers continue to produce energy products, at least for a time, until the low prices become a real problem.
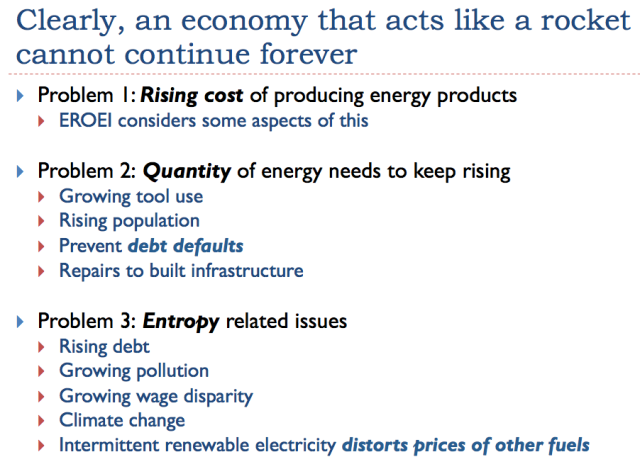
There are many reasons why an economy, which acts like a rocket, cannot continue forever.
Many readers have heard of “Energy Returned on Energy Invested” (EROEI). This is a favorite metric of many energy researchers. It is calculated by dividing Energy Out of a system by required Energy Inputs. As I show on Slide 25, EROEI looks at one part of one problem that economies encounter. There are many other problems and parts of problems that EROEI doesn’t consider.

Many believe that renewables can replace “Other Energy.” One reason for this belief is the fanciful claims by some researchers. Another reason for this belief is the apparently fairly favorable EROEI calculations that seem to occur when these devices are examined. These calculations are very limited. They don’t examine the many adverse impacts of adding tools and technology, and the rapid rise in debt that would be required.

Trying to run the economy on solar electricity alone (or solar plus wind plus water) is a futile exercise. One reason is that it would require massive changes to allow long-haul trucks and airplanes to operate on electricity.
Also, electricity is a high-cost energy product. Today, our economy operates on a mix of high and low cost energy products, with low cost energy products keeping the average cost down. Trying to run the economy on electricity alone is a bit like trying to run the economy using only PhDs. In theory it could be done, but it would be expensive to have PhDs waiting on tables in restaurants and delivering mail.
Too often, researchers make models without determining the details of how the system would really need to operate and what the cost would be.

There are many different limits, for any kind of system. For example, one limit for humans is having enough oxygen. Another limit for humans is having enough water. A third limit is having enough food. Any of these things are limits. The trick is trying to figure out which one is the first limit, in a particular situation.
EROEI based on fossil fuel inputs was developed when it looked like there would be a shortfall of fossil fuels. If, in fact, our problem is not being able to get the price of fossil fuels high enough, this is a different, more complex, problem.
I think of the ratio that is popularly computed as EROEI as “Fossil Fuel EROEI.” Fossil Fuel EROEI is popularly believed to be a limit, but it is not at all clear to me that it is the first limit. It is also not clear that the limit is any particular number (such as EROEI=1, or EROEI=10).
There is a different kind of EROEI that seems to me to be at least as likely, or more likely, to be the first limit that we will reach. That is the return that workers who are selling their labor simply as labor (without advanced education or supervisory responsibility) obtain. If these workers find that their wages drop too low, this will be a limit on the operation of the economy. Low wages will prevent these workers from buying houses and cars. If the wages of the large number of non-elite workers fall too low, commodity prices will tend to fall, and the system will tend to collapse because producers cannot make a profit at such a low price.
Biologists have been studying the return on the labor of animals for many years, because their populations tend to collapse, when animals are forced to expend too much labor in finding food. EROEI based on wages of non-elite workers would seem to be a closer parallel to the animal return on labor than fossil fuel EROEI.
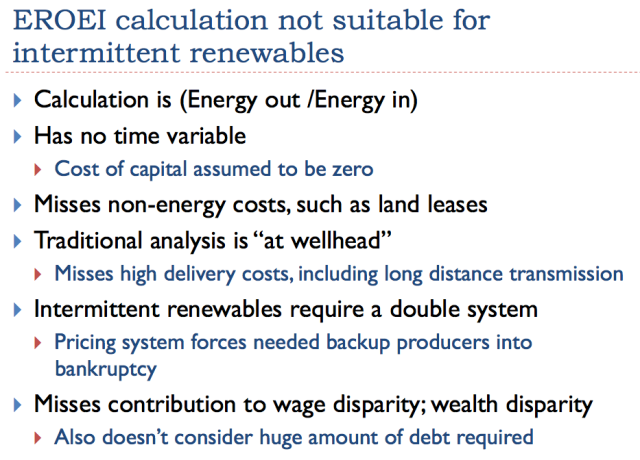
I have laid out a few of the issues I see with EROEI of intermittent renewables on Slide 29. There are other issues as well. For example, because it is a prospective calculation, it is very easy for wishful thinking to lead to optimistic estimates of future energy production and expected lifetimes of the devices.
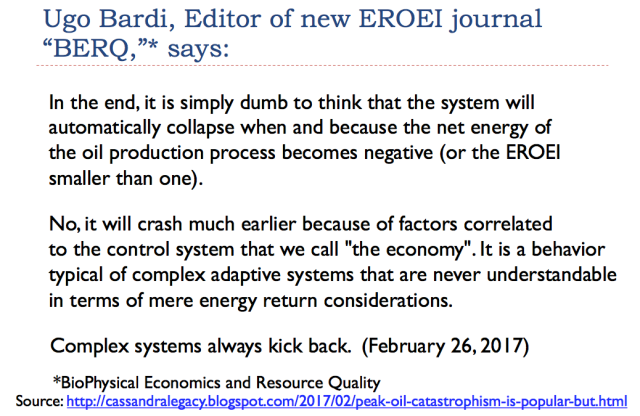
Energy researchers have defined “net energy” to be any energy in excess of EROEI = 1. There is a common misbelief that if the economy can continue to produce energy products with an EROEI above 1, everything should be fine. In fact, some studies commissioned by actuaries regarding whether the economy is reaching energy limits seem to be based on an assumption that producing energy products with an EROEI > 1 is sufficient to prevent energy problems in the future. This is not a high threshold. Given such an assumption, our problems with energy seem to be far, far in the future. Pensions can continue to be paid as planned.
On Slide 30, Ugo Bardi is saying that this assumption is not correct. It is not true that the system will crash when the net energy of a particular fuel (here oil) becomes negative. We cannot understand the behavior of a complex adaptive system such as the economy in terms of mere energy return considerations. Clearly, I am not the only one looking at the economy in broader terms than an EROEI ratio.

Where we are now.

It is hard to see any good fixes. Technology reaches diminishing returns. Neither renewables nor nuclear is really working well now.

The standard forecasts seem to be based on the assumption that the economy can grow forever.
We have many problems that have been missed by recent economic modeling, including models commissioned by actuaries.
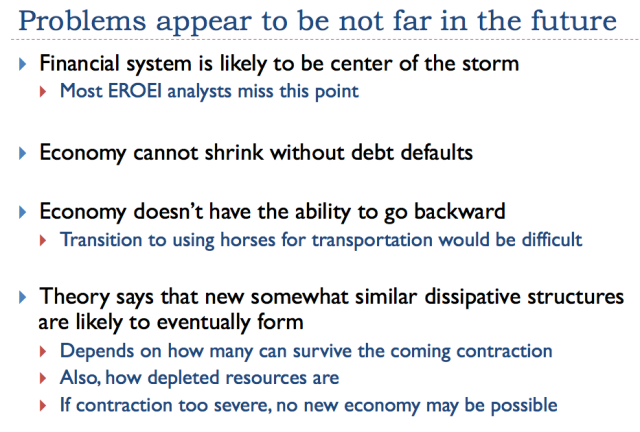
Actuaries are involved primarily with insurance companies and pension plans. My concern is that the financial system will be the center of the storm, as we hit limits this time. This will affect actuaries and their work.
Whether or not a new economic system can arise to take the place of our existing system remains to be seen. It certainly is a concern.
Two Observations
- My write-up is probably more complete than the actual one-hour talk was.
- I don’t think that anyone can be “blamed” for the confusion about what EROEI means. Our understanding of how the economy works is gradually evolving. Written documentation about EROEI is found in a myriad of academic papers. The name “Net Energy” seems to give energy in excess of EROEI=1 more importance than it really has.
Disclosure: None.


Fascinating article to say the least. Interesting for me, the point about the impossibility of jubilee. Clearly though, a mechanism has to be established to give taxpayers a reasonable profit on the debt that is created by government. After all, that debt is used as gold by insurance companies, pensions, banks etc. But that debt being used as gold does require that the economy work. It does require that interest is paid. It does show us that debt as gold in usage as collateral should be paid for by those using it as collateral. Debt is so valuable as collateral that taxpayers should be compensated and they are not adequately compensated. I don't mean that interest rates should be higher, just that some value should be placed on bonds that reflects their value to Wall Street and to the financial system. That is not happening now.
Also, author's point about labor is important. Trump says he wants better paying jobs, but he is undermining labor in almost every decision he is making. He undermines their social security, medicare, health insurance, public schools. Labor is not treated with the respect it deserves. Capitalists need labor to buy their stuff. And pretty soon, if that demand goes away, if effective demand limit is reached per Edward Lambert, there won't be capital formation. Then the author of this article could be proven right. There was always the outlet of war, but now that road leads to mass nuclear destruction.
Wall Street needs to think more about this stuff. Hiding money is just one more tearing at the fabric of society. And certainly hiding money gets you elected president of the USA now. That is a sign of ultimate destruction of prosperity, not the enhancement of it.