
Why Counter-Cyclical Is Outperforming Cyclical Sector
Extraordinary Rally, Stagnant EPS Estimates
The S&P 500 has been on an amazing run as it has increased 20.5% since the Christmas Eve bottom. It is up 1.74% in March and 13.01% year to date. This is the best first quarter since 1998. This has been a global rally as every country ETF except Qatar is up in 2019. The average country return as of March 15th is 11%; that is the highest average since 1987. The S&P 500 is 3.34% off its record closing high in September.
As you can see from the table below, The Earnings Scout shows Q1 EPS is expected to fall 0.5%. Traders are paying up for declining earnings.
$SPY EPS growth estimates were little changed last week. pic.twitter.com/fx1eGfIIeS
— The Earnings Scout (@EarningsScout) March 18, 2019
To be fair, when stocks cratered in Q4, they were falling as earnings were growing. It appears the rally in January and February was about the market correcting itself as it mistakenly priced in a recession in December. Even though the numbers don’t look great, since the beginning of March, the estimate decline has slowed. That has helped stocks.
The table shows Q1 growth estimates from March 1st to March 18th only fell 0.6%. Part of the reason estimates haven’t fallen much is because earnings season is over. There aren’t many firms issuing terrible guidance to catalyze negative estimate revisions. As we’ve mentioned previously, even though FactSet shows lower EPS growth estimates, it still shows revenue growth will be in the mid-single digits in Q1. The Earnings Scout doesn’t see an earnings recession as EPS growth is expected to be in the low single digits in Q2 and Q3. Those estimates will be strongly affected by guidance from Q1 earnings season.
Utilities Ramping
The chart below shows the ratio of the cyclicals divided by the defensives is underperforming the S&P 500. To be clear, the cyclicals are consumer discretionary and the utilities are defensives.
A healthy market rally would not have cyclical sectors lagging as much as they are today. Caveat emptor pic.twitter.com/hgHre8vC2Y
— Variant Perception Research (@VrntPerception) March 18, 2019
A big reason for this change in the relationship is the decline in treasury yields which is pushing money into the utilities. Utility stocks trade based on their dividend yield. Plus, the yield curve flattening and the economy slowing make utilities do well in the ‘risk off’ trade. Finally, the utilities are seeing relatively solid earnings revisions.
The consumer discretionary stocks have been underperforming recently. They could be a good place to invest as real wage growth is strong and Costco recently reported solid earnings. The most perplexing rally is in the semiconductor industry. The SOXX semiconductor index is up 19.78% year to date despite the sector’s highly negative earnings revisions and the declining global demand for chips.
Tightest 10 Year 2 Year Range Ever
As we mentioned, treasury yields have fallen in the past few weeks. Bond traders have a different opinion of the stock market than stock traders. Another oddity of the treasury market is the extremely tight range the 10-year 2-year yield spread is in. As you can see from the top chart below, the spread between the two yields has been in the high teens since late 2018. This spread is the most cited one when investors and economists look at the yield curve.
(Click on image to enlarge)
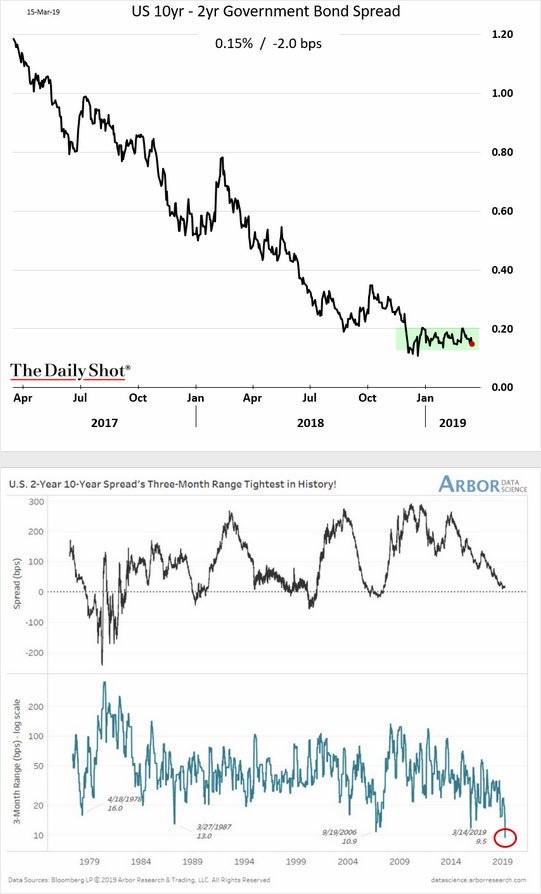
The bottom chart above shows the 3-month range of this spread is the tightest ever. This could signal that the yield curve is about to have a big move soon. Since other parts of the curve have inverted, the big move might be towards an inversion. The curve could invert because the 2-year yield doesn’t have much room to fall since it’s only 7 basis points above the Fed funds rate. If the 10-year yield falls, it will close the gap quickly.
Investors have gotten used to this spread staying the same, but it can easily invert in a few days when this placid action ends. The good news is an inversion doesn’t mean a recession is coming in the near term. We’ll review that information when this portion of the curve inverts.
Stable NAHB Housing Market Index
As you can see from the chart below, the housing market index in March was the same as February as it stayed at 62. It missed estimates by 1 point.
NAHB: Builder Confidence "Steady" in March https://t.co/vJkgby8eMy pic.twitter.com/cyHhtEbNn6
— Bill McBride (@calculatedrisk) March 18, 2019
Just because there was no change, doesn’t mean there’s nothing to learn from this report. The traffic index fell 4 points to 44 which signals traffic is falling at a quicker pace. This decline supports the MBA Applications report’s findings which showed the upper end of the housing market is doing well, but first-time buyers (lower price point) aren’t as interested in dipping their toe in the water. The current sales index increased 2 points to 68. 6-month sales increased 3 points to 71. Those 2 indexes are the highest since October. The South and West indexes were at/near 70, while the Northeast and the Midwest were near 50 which is the flatline.
JOLTS Beats Estimates
Since the Job Openings and Labor Turnover report was from January, it’s no surprise the reading was fantastic as the BLS report showed 311,000 jobs were created in that month. As you can see from the yellow line in the chart below, total job openings increased from 7.479 million to 7.581 million (a 1.4% increase) which surpassed estimates for 7.2 million and was above the high end of the estimate range which was 7.335 million. The December reading was revised from 7.335 million.
Unlike some of the weak reports, this reading showed hiring increased along with openings as hirings were up 1.5% or almost 100,000 to 5.801 million. Even with this increase, the difference between openings and hires increased to a record 1.78 million. Openings and hires were up 21.4% and 4.2% yearly. Quits increased almost 100,000 to 3.49 million which shows there is moderate mobility in the labor force. People feel comfortable quitting their jobs because there are alternatives which provide more pay.
BLS: Job Openings Increased to 7.6 Million in Januaryhttps://t.co/SOeKfP2gH9 pic.twitter.com/d1wU5hl8gQ
— Bill McBride (@calculatedrisk) March 15, 2019
The chart below shows the construction and manufacturing industries have very tight labor markets. The ratio of construction workers trying to get a job to the total jobs available in this industry was 33.5 to 1 in January 2010 which was a record high. This ratio has fallen to 1.8 to 1 which is a record low.
In January 2010, there were 2.194 mn unemployed construction workers vying for just 54k job openings, a ratio of 33.5-to-1 (a record high). In January 2019, there were 638k unemployed construction workers vying for 302k job openings, a ratio of 1.8-to-one (a record low). pic.twitter.com/i63udOAvMv
— Jeoff Hall (@JeoffHall) March 15, 2019
Conclusion
The stock market and treasuries have had an amazing year. Will that continue once the 10-year 2-year spread inverts? Last year stocks sold off at the sight of a potential inversion. On average, stocks don’t fall immediately after inversions as recessions start over a year after the curve inverts. When the curve steepens, it’s a sign a recession is coming soon. The housing market should improve this spring. So far, we mostly see strength in the upper end of the market. The labor market is very tight as hiring increased 1.5% in January on a monthly basis. The caveat here is the labor market only added 20,000 jobs in February (subject to 2 revisions).
Disclaimer: Please familiarize yourself with our full disclaimer here.


