
Why A New Long-Term Uptrend In Interest Rates Has Begun
The big market news on April 24th was the 10-Year US Treasury yield went above 3%. While there is nothing magic, per se, about the 3% level on this benchmark government bond (it is actually quite low historically), the importance lies in that it is the highest level since 2014, and is a very likely confirmation of a change in a 30+ year downtrend in interest rates. Since the early 1980’s, falling rates have offered a tailwind for stock prices. For the next decade or two, rising rates are likely to act as a headwind.
Unlike stocks prices, which are more volatile, bond prices move in very long cycles (interest rates of course move in opposite direction of bond prices). Historically, an uptrend or downtrend in U.S. interest rates has lasted from 22 to 37 years. Tops tend to be sharp and brief, while bottoms tend to be long and rounded or flat. The bottoming period can last from 2 to 14 years.
10-year Treasury yields last peaked in September 1981 at approximately 15.82%. They fell to 1.39% in July 2012 —an almost 31-year decline. They then rose until they reached 3.04% in December 2013. Yields then fell again until they hit a low of 1.34% in July 2016. They recently reached 3.04% on April 25, 2018. So, we can say there was a 31-year downtrend and a 6-year bottom put in place, so far. Note from the chart below that in the downtrend in yields there were seven lower lows up to July 2012. The price low in July 2016 is more correctly considered a double bottom. There are also seven lower highs with the December 2013 one being the last. To break the 31-year downtrend (and to confirm the double bottom), the yield must establish a higher high than 3.04%.
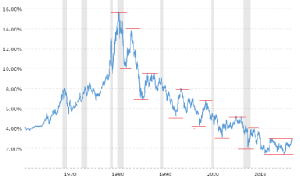
It can be said with great confidence that this will occur, and that has been known since January, 2018. How can we tell? All we have to do is look at the monthly chart. At the almost 8,000 member New York Investing meetup, the criteria we use to describe a long-term bullish uptrend is fully met in the 10-year Treasury chart. It takes a lot of time for everything to line up perfectly for a bullish (or bearish) trend on a monthly chart. So, once established, the trend will last many months, and sometimes a decade or more. Here is the commentary and chart from our New York Investing Market Newsletter published in early April:
U.S. 10-year treasuries (government bonds) interest rates have more than doubled since the low in the summer of 2016. The chart is very bullish indicating interest rates are likely to keep rising (baring a major financial crisis). The moving average pattern is the bullish 10-month, above the 20-month, above the 40-month, with the yield trading above the 10-month. The RSI is above 50. The MACD is above zero, and on a buy signal. The DMI is bullish with the D+ blue line above the D- red line and the black trend line has crossed the red line from below giving a more important buy signal.
Since the 10-year yield touched 3.04% on April 25th, it is on the edge of breaking out. For a breakout to be considered to have taken place, the yield needs to trade at least 10 to 15 basis points (a basis point is 0.01%) higher for several days. Admittedly, this is a somewhat arbitrary number. The long-term charts indicate this will happen, and as long as the bullish pattern remains in place, investors should be “buying the dips” in yield (or selling the peaks in bond prices). No matter how bullish a chart is, there will always be retracements along the way, and some of them will be significant.
The average investor can use ETFs to trade yields on the 10-Year Treasury. To do so, it is necessary to trade ETFs that are short the bond. TBX is a good choice for this. For those investors who are willing to take on more risk, DTYS, PST and TYO can be used. DTYS has a variable amount of leverage, PST is leveraged two times, and TYO is leveraged three times.
Disclosure: None.


