
Who's Afraid Of The Big Bad Bull In 2020?
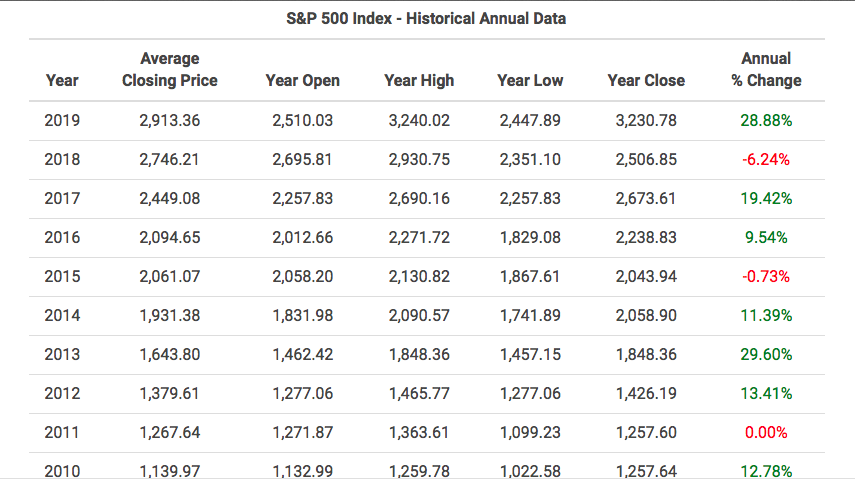
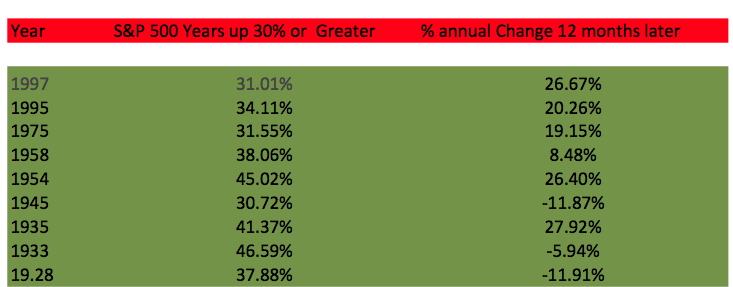
If only every year was like 2019 for the S&P 500 (SPX). For the year, the benchmark index failed to achieve a 30% gain, but most investors are rather satisfied with the 28.88% return and looking forward to the New Year. A quick look back on the last decade (2010s) shows that the market had a substantial rise and only 2 down years. If we include the dividend i.e. total return, only 2018 was a negative year for the S&P 500.
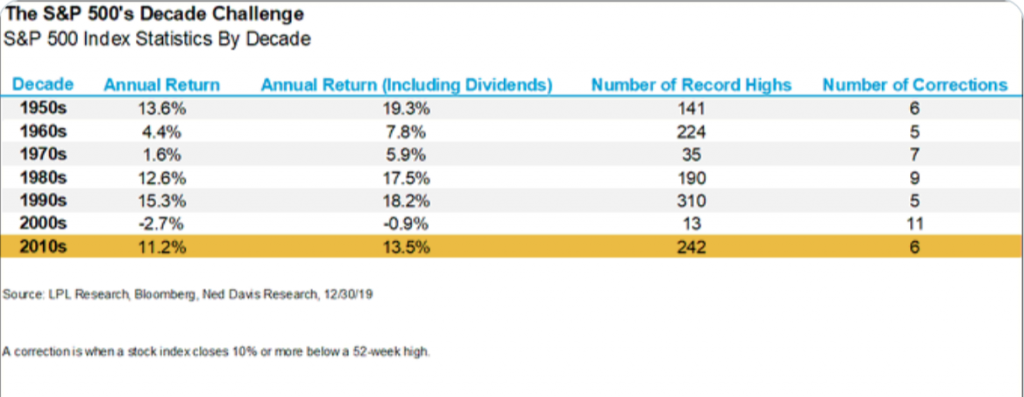
When it was all said and done for the decade, the S&P 500 delivered an annual return of 11.2% through the 2010s. Additionally, while that was above average over the last 2 decades the 2010s only ranks as the 4th best decade over the past 70 years? (Table from LPL Financial)
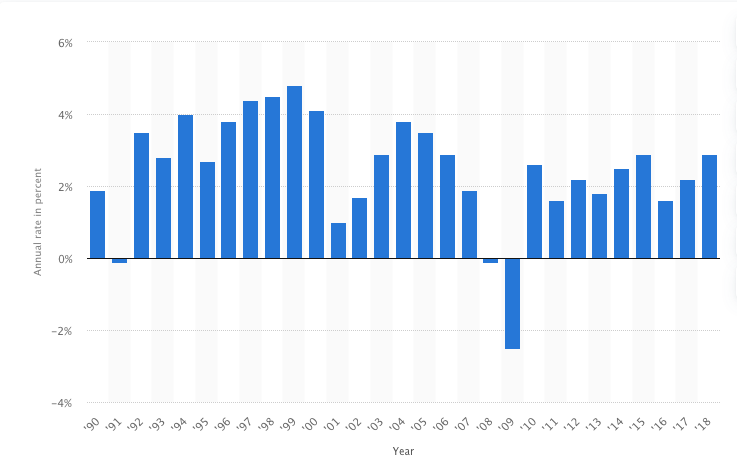
Here's the funniest thing about the 2010s and the more than decade long expansion cycle still underway: Oddly enough, the strongest GDP year for the economy over the last decade was... drumroll... 2018! As a reminder, 2018 was also the only year the S&P 500 was down on a total return basis. Funny how these things play out, isn't it? (Real GDP chart by year)
Through the first 3 quarters of 2019, recession talk was all the rage, as the yield curve inverted and the ISM manufacturing index slipped into contraction territory. Global PMIs didn't fare any better as they also found contraction territory. The New York Federal Reserve Bank recession probability index ticked all the way up to 38.8% during the year, which only added fuel to the recessionary narratives thrown about by analysts, economists and media pundits.
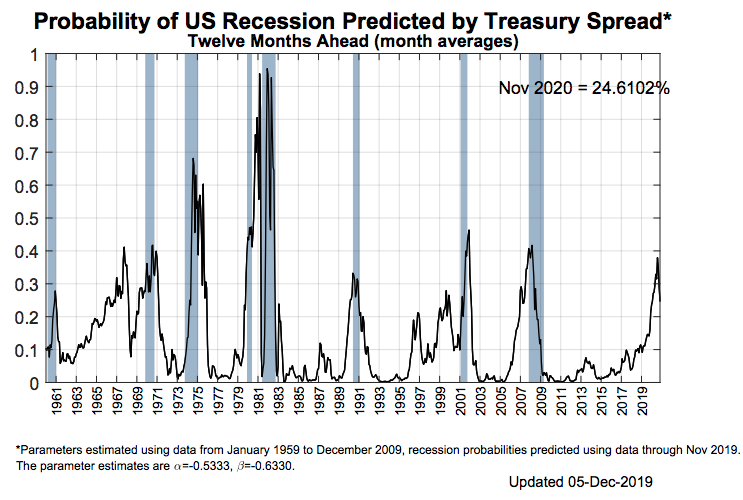
It was an anxiety-riddled year for investors, as N.Y. Fed recession indicator has never failed to predict a recession within the next 12-months since the 1970s. Bloomberg Economics created a model to determine America’s recession odds also. The latest update, which looks at October data, estimates the chance of a U.S. recession within the next year at slightly higher odds when compared to N.Y. Fed recession index. Bloomberg's recession odds over the next year are currently at 29%, after an upwardly revised 27% in the prior month. That reading is lower than highs reached earlier this year and will likely move lower given initial positive readings across November's economic data.
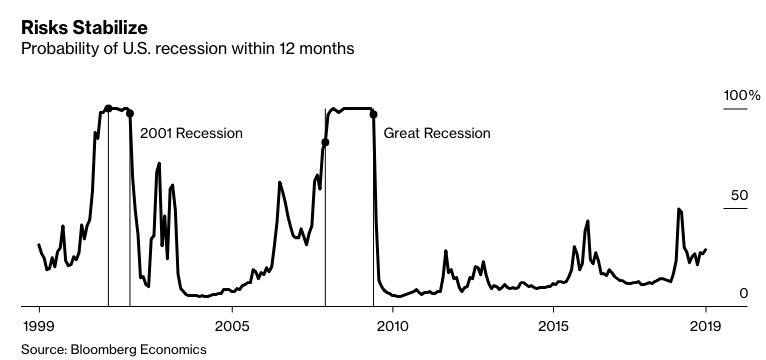
The small increase in the recession probability recently reflects a deterioration in the Conference Board’s Leading Economic Index, a composite of 10 different indicators. The six-month growth rate turned negative for the first time in over 3 years, driven by weakness in factory orders, average weekly hours and filings for U.S. unemployment benefits.
As we look back on 2019, I think its safe to say that 3 issues will still linger with investors in 2020
- Trade war
- Central bank easing/policy
- Yield curve
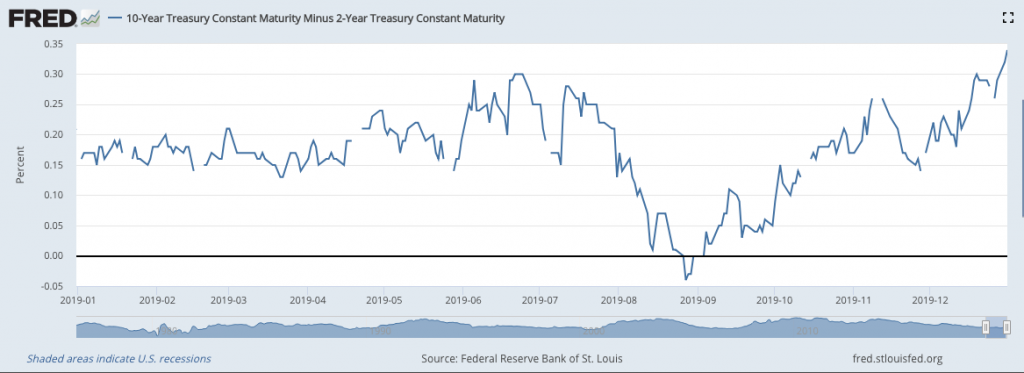
As it pertains to the yield curve, it has steepened to the greatest point over the last year, at the tail-end of the decade.
This is a positive takeaway for big money center banks and lending with net interest margins rising as the yield curve steepens. For those who are not familiar with the bond yield curve, here's some more definition and chart support.
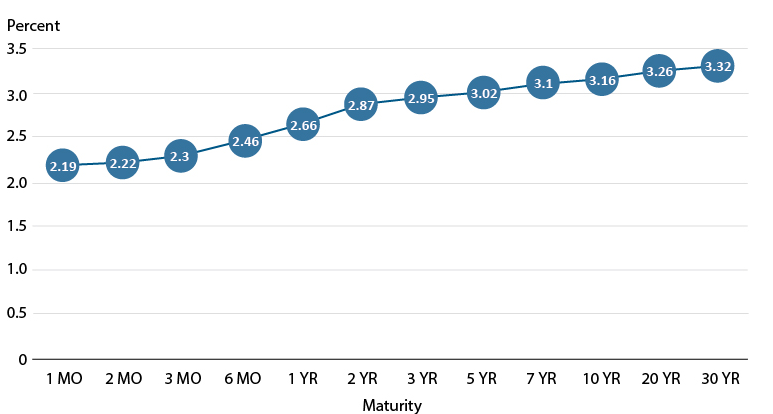
The yield curve is a graph that shows the yields of U.S. government bonds, or Treasuries, with different maturity dates. Under normal conditions, if you plot in a graph the yields of Treasuries of increasing maturity and connect the dots with a line, you will see an upward-slopping line or curve. Figure 1 shows a "normal" yield curve.
I denoted the yield curve inverting this year at at least two critical points, the 3-mnth/10-yr and 2-yr/10-yr . The main concern for the economy arrives when the long-end of the yield curve (2/10yr.) inverts. This is when most "recession clocks" start ticking, so to speak. The funny thing about the yield curve inverting that always seems to cause a market panic, as it did in mid-August this year, is that typically the market has a strong rally after the inversion takes place. Jonathan Golub, chief U.S. equity strategist at Credit Suisse offered such notes in this regards back in August and as follows:
"While an inversion has preceded each recession over the past 50 years, the lead time is extremely inconsistent. Historically, an inverted yield curve has been accompanied by a variety of other ominous economic signals including layoffs and credit deterioration.”
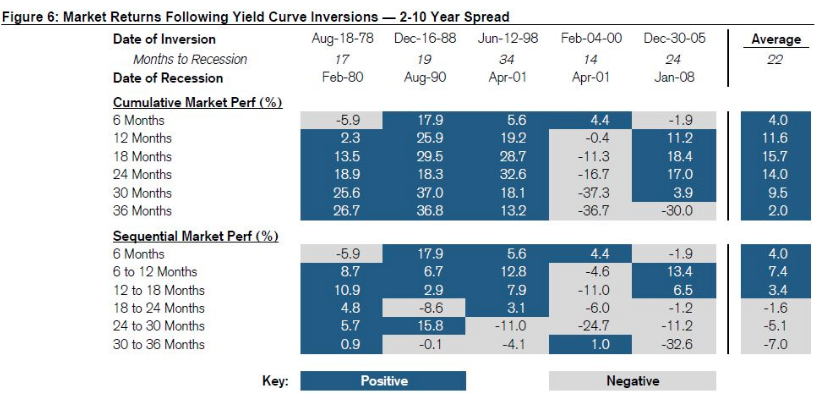
I urge investors to consider that each firm has their own statistical data and it largely depends on where they begin and end their study and collection of data. Recall that J.P. Morgan Chase also outlined their studies on yield curve inversion, timeline before a recession occurs and more. Where Credit Suisse’s data suggests 22 months before a recession, J.P. Morgan’s data suggests a recession occurs, on average in just 14 months. This is because the J.P. Morgan includes 1968 and 1973 in their study while the initial inversion dates also vary thereafter from that offered by Credit Suisse.
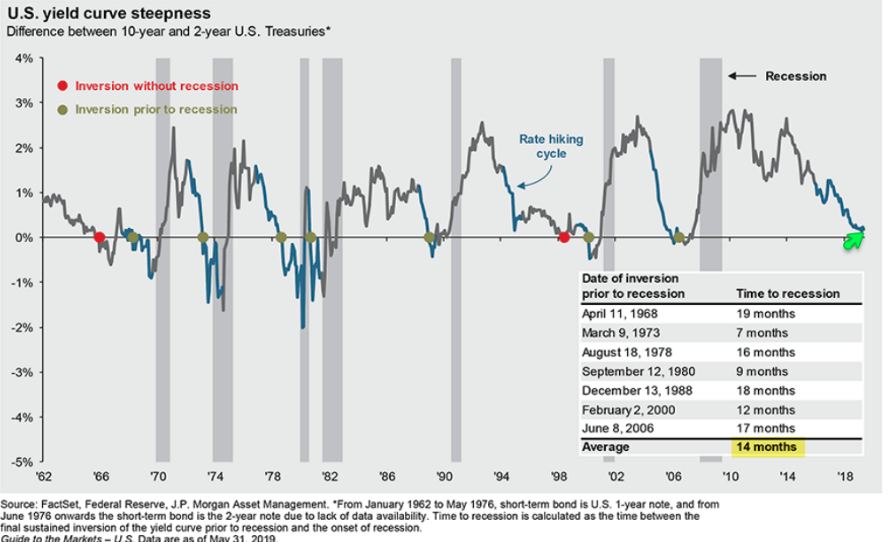
I guess the point is, nobody seems to have perfect data and perspectives vary as to when recessions start. The key takeaway here and as we now enter 2020 is that just because the yield curve has now un-inverted, doesn't mean the clock has stopped ticking towards a recession according to the historic timelines.
Moreover and continuing with this bit of "Debbie Downer" recession talk, the St. Louis Fed also suggests the economy may not be out of the woods yet based on 3 of its 4 leading economic indicators. But they also make another suggestion when it comes to leading economic indicators that didn't seem to prove out a recession in the late 2019--early 2020 time frame.
- One hazard of leading indicators is that they can lead to misinterpretation and complacency. If the economic slowdown signaled by weakening housing indicators and some portions of the U.S. Treasury yield curve inverting in 2019 does not begin immediately, some observers may think the precautions undertaken in response to the signals, such as the Fed’s recent easing of monetary policy, can void the signals themselves and pre-empt a recession.
- This would run counter to the historical patterns documented in this article: The Fed eased monetary policy and mortgage rates plunged in advance of each of the three previous recessions, yet the economy still went into a downturn. Thus, the value of leading indicators may lie more in their role as early warning signals that help us better prepare for, rather than outright prevent, a recession.
- This time could be different, however, if the Fed’s timely interest rate cuts and other factors, in fact, help to prevent a recession in late 2019 or 2020. If that happens, we should re-examine the indicators that have been successful in signaling recessions in the past. In the meantime, we should not dismiss their salience.
Based on much of the Q4 2019 data received thus far, including upwardly revised Q4 GDP estimates since the quarter began, it does not appear as though a recession will occur in early 2020. Naturally, the caveat to this suggestion would be an exogenous and un-forecastable event. Nonetheless, I'd like to focus on that 2nd bullet point from the St. Louis Fed statements.
"The Fed eased monetary policy and mortgage rates plunged in advance of each of the three previous recessions, yet the economy still went into a downturn."
Let's recall that the Fed lowered rates by 50 bps back in 2007 and prior to the Great Financial Crisis and subsequent recession. Recession rate cuts are usually found with 50 bps tranches. Insurance rate cuts, like those in 1995, are those which spearhead a slowing economy and aim to right size certain imbalances in order to sustain economic growth. Regardless, of the defined cuts, there were no rate cuts that could be found to stave off the imbalances in the financial system via excessive leverage back in 2007-2008. Rate cuts had nothing to do with the recession and therefore proves irrelevant in the conversation.
Prior to the 2008's recession was the 2001 recession. Can we really call 2001 a recession because some would argue that with a GDP of 1% for the year, it was not a recession at all. (GDP chart from 200-2003)
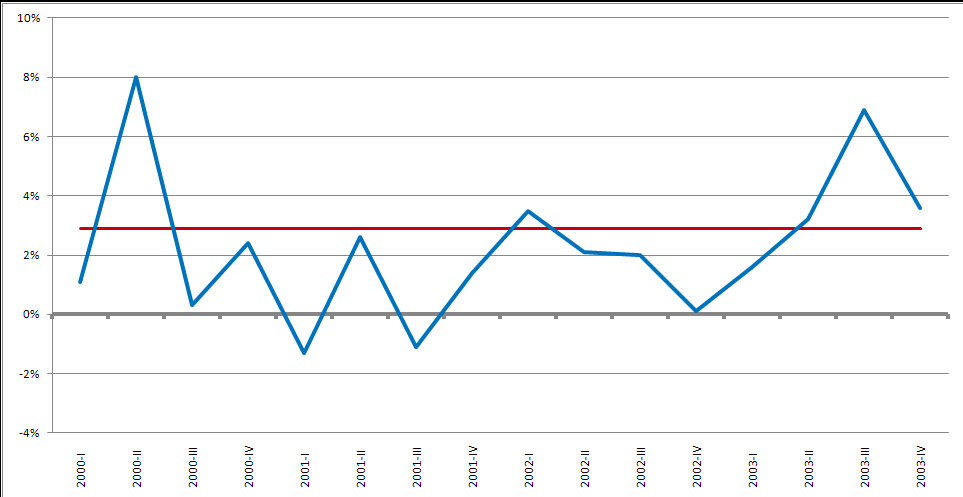
Moreover, the so-called 2001 recession was deemed to have concluded in just 8.5 months, on November 20, 2001.
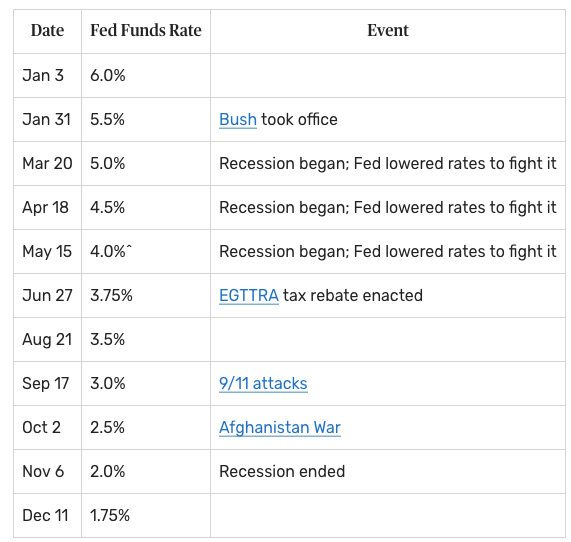
The point, however, pertains to the St. Louis Fed's statement about rate cuts that didn't stave off a recession. But when we examine the Fed Fund's rate event and activity table above we come to find that once again during the 2001 recession, the Fed was late with policy measures and forced to issue recessionary rate cuts of 50 bps points. Not to belabor the point, but do we really need to travel back to the 1990-1991 recession to emphasize the difference between present-day rate cuts and recessionary rate cuts? Something tells me even with the Fed cutting rates only 25bps back then, a recession was inevitable as the attack on the consumer was what caused the recession. What do we mean by the attack on the consumer?
Remember, there has only been one tried and true determinant for which when this happens, so does a recession. Looking at the historical data back to 1970, the math suggests it takes a near doubling of oil prices over a 12-month period or less to make a U.S. recession inevitable and/or portend stock market concern/volatility.
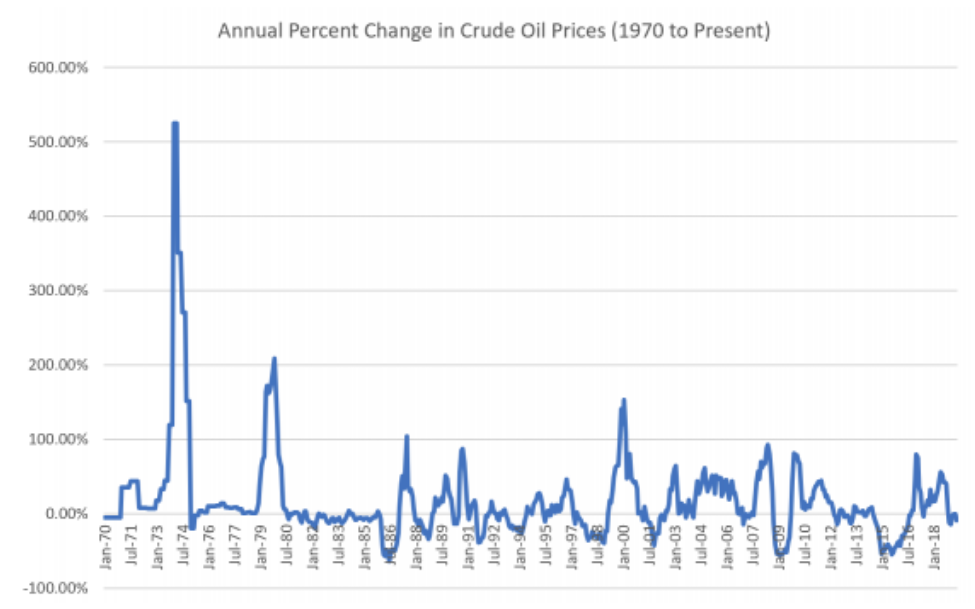
The U.S. has NEVER seen a recession (back to 1970) w/out oil prices 1st rising by +90% over a year.
- March 1974: +525%, from $2.08/barrel in the same month the prior year to $13.00/barrel
- November 1979: +209%, from $13.20/barrel to $40.75/barrel
- August 1987: +104%, from $9.62/barrel to $19.62/barrel
- October 1990: +87%, from $18.42/barrel to $34.50/barrel
- February 2000: +153%, from $10.75/barrel to $27.22/barrel
- June 2008: +93%, from $68.18/barrel to $131.52/barrel
Of course, when we look at the occurrences from the list above for when oil prices gained by 87% or better, October of 1990 shows up. Oil was already up roughly 70% by july 1990 and by October of 1990 the National Bureau of Economic Research called the recession. The Fed was fighting inflation while the U.S. had engaged in the Gulf War. Neither of these two issues seem as relevant today, even if tensions escalate between Iran and the United States. Let's face it, if bombing Saudi oil fields can sustain elevated crude prices...
Okay, some of you are getting bored and probably want to know what to expect for the first trading day of the year, right? No worries, orrrr...
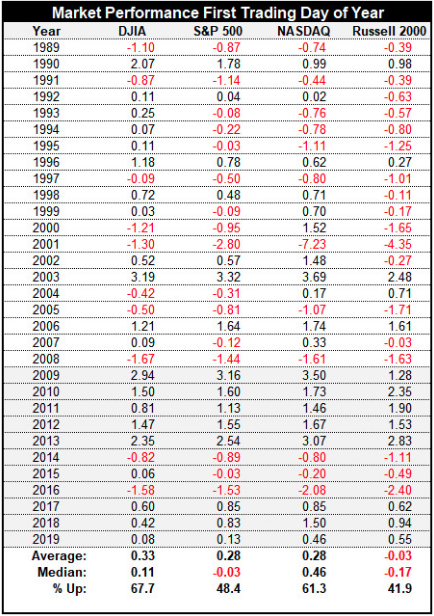
Here's what I found from the Trader's Almanac: In contrast to the last trading day of the year, the first trading day of the New Year has a bullish track record over the last decade or so. Since 2009, DJIA has advanced 9 times in 11 years with an average gain of 0.71%. The S&P 500, NASDAQ and Russell 2000 have risen in 8 of those years with averages gains of 0.85%, 1.01%, and 0.73% respectively. However, the longer-term history, back to 1989, has not been as strong. DJIA is best, up 67.7% of the time with an average gain of 0.33% while Russell 2000 has only advanced 41.9% of the time with an average loss of 0.03 percent. The S&P 500 is up roughly 48% of the time with a gain of just .28 percent.
Now back tot he serious business of 2020 and a more favorable narrative regarding recessions from Goldman Sachs. The firm's economists said a downturn is unlikely over the next several years. In fact, the firm’s economists stopped just short of saying that the U.S. economy is recession-proof.
An analysis Goldman conducted of the current potential risks to growth show that they are mostly muted. The report found that the pillars of the “Great Moderation” that began in the 1980s, low levels of volatility marked by sustainable growth and muted inflation, interrupted only by the financial crisis more than a decade ago, are still standing.
“Overall, the changes underlying the Great Moderation appear intact, and we see the economy as structurally less recession-prone today,” Goldman economists Jan Hatzius and David Mericle wrote. “While new risks could emerge, none of the main sources of recent recessions — oil shocks, inflationary overheating, and financial imbalances — seem too concerning for now. As a result, the prospects for a soft landing look better than widely thought.
“We think the prospects for a soft landing in the next few years are better than widely thought, and considerably better than the historical odds would suggest this deep into an expansion."
I could literally, quite literally go on and on about recessions and recession probabilities going forward; heck the media makes a living off of hyperbolizing the subject. The fact is that the macro-fundamentals don't support a recession over the next 12- month period. A lot can happen between now and then to change that outlook, but it will likely have to find the price of oil rising significantly alongside rates, the labor market cooling off dramatically, wages contracting and consumer spending mirroring the contraction in wage growth. What will cause all of that is anybody's guess, but don't count on the subject matter dying off in 2020 just because the yield curve has been steepening. Ray Dalio has made a name for himself simply on the basis of adjusting his recession forecast every other month.
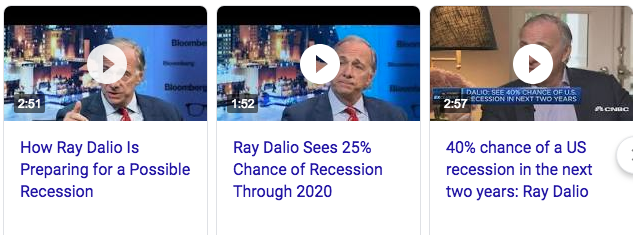
As head of the Bridgewater Fund, the guy is all over the place with his recession forecasts. The worst part about his up and down forecast is that 2019 was also a very poor year for Dalio. Ray Dalio's Bridgewater fund performed "very poorly" in 2019 and is on track for its first losing year in some time, according to Bloomberg's Katherine Burton.
Calling a recession is very difficult absent the significant rise in oil over a 12-month period. Simply put, the economy doesn't simply ease into a recession like an old man into a bathtub. A recession demands a catalyst and most catalysts are provided by excess build-up of leverage/imbalances in the economy or an exogenous event. For now, we'll leave the recession forecasts for those who choose to take on the futile endeavor. With that being said, the economic data will aid in guiding our outlook for 2020. Speaking of economic data...
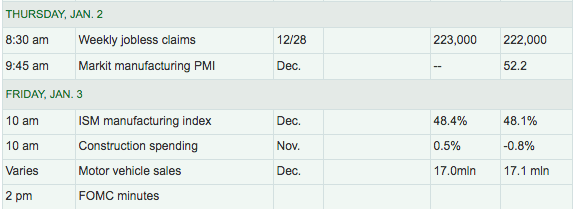
Weekly jobless claims spiked 3 weeks ago as seasonal factors loomed large but has since drawn lower in each of the past 2 weekly reports. On Friday, investors will look to the ISM manufacturing index to provide support for investor sentiment at the onset of 2020. Most economists are only looking for a slight uptick in the ISM manufacturing index, but Finom Group wouldn't be surprised if it came in above expectations. Speaking of the ISM manufacturing index and confidence, but consumer confidence...
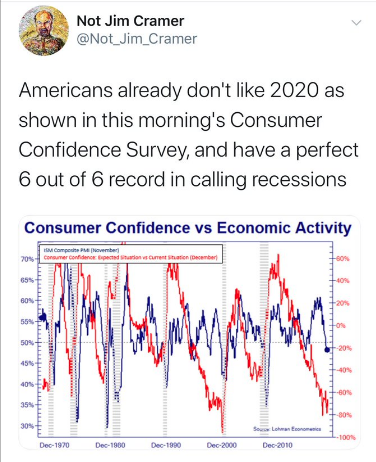
When I see charts like this plastered throughout social media it pains us. 107 Twitter accounts liked this tweet within the first hour it was issued. After analyzing the data and nuances in the chart, can anybody guess why this is known as a "chart crime"? If you can, I'd love to hear from you in the comment section below! And don't forget, just because the S&P 500 was up nearly 30% in 2019, that doesn't mean 2020 won't deliver solid returns.
Have a great 2020 everybody; trade safely and with a sound macro-thesis in tow!


