Which Came First—The Chicken Or The Egg?
A funny thing happened one day last week when I walked into the office. No, this is not the setup for some joke; rather, I’m referring to what I heard regarding movement in the stock and bond markets. Specifically, the narrative was that the decline in U.S. equities resulted from the drop in the U.S. Treasury (UST) 10-Year yield. Because I’ve been a “bond guy” for quite some time now, the rhetoric was fascinating to me and brought to mind this age-old question: Which came first—the chicken or the egg?
In my experience, the bond market typically reacts to developments in the stock market, not the other way around. Being a baby boomer (right at the tail end, mind you), I thought: Am I missing something here? Could the paradigm have shifted? Thus, I decided to do a little bit more investigating, and what I found was that, in my opinion, no, the paradigm had not shifted. The recent decline in the UST 10-Year yield had its genesis in the latest sell-off in the stock market, which began in early May and continued throughout the month.
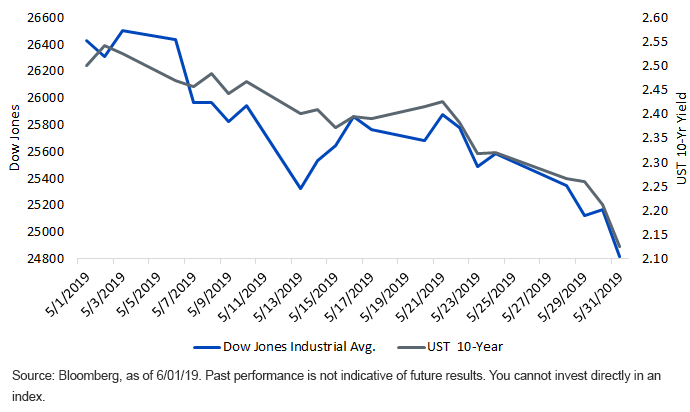
Dow Jones Industrial Avg. vs. UST 10-Year Yield

Take a look at the graph. The UST 10-Year yield was essentially straddling the 2.50% threshold in the opening days of May until the Dow Jones Industrial Average (DJIA) took a nearly 475-point nosedive on May 7. This began the downward trend in which we find ourselves now. Remember, that trend was in response to the breakdown in U.S./China trade talks and the attendant escalation in “tariff talk.” Then round 2 hit as the DJIA plunged 617 points on May 13, leading the UST 10-Year to break through the 2.40% level, ultimately falling down to 2.37%—which, at that time, matched the 2019 low watermark set back in March. Notice how stocks rebounded somewhat after this episode—and what did the 10-Year yield do? That’s right, it moved back up as a result.
Then round 3, or the 286-point drop in the Dow on May 23, which took the UST 10-Year down to 2.32%, ultimately penetrating a key technical level soon thereafter. That brings us to where we were as of this writing: a cumulative 1,600-point plunge in the Dow and a nearly 40 basis point drop in the UST 10-Year yield to 2.12%.
Conclusion
During May, there is no doubt the bond market received some softer-than-expected economic data. However, the data stream overall was mixed (strong jobs), and did not point toward a likely recession anytime soon. We all know that trades and tariffs are a wild card right now, and the upcoming G20summit in late June will be scrutinized for any thawing in the U.S./China dispute (and throw Mexico into the mix as well). Until the fear and uncertainty quotients get dialed back and the stock market can stabilize (hopefully, not a big “if”), the Treasury market will more than likely continue to take its cue from the “risk-off” trade. That being said, don’t lose sight of the upcoming jobs report and Federal Reserve meeting later this month.
Unless otherwise stated, data source is Bloomberg as of June 1, 2019.
Disclaimer: Investors should carefully consider the investment objectives, risks, charges and expenses of the Funds before investing. U.S. investors only: To obtain a prospectus containing this ...
more


