
Where US Spending, Taxes, Deficits: Looking Back 50 Years
Of course, there's nothing sacred about looking at average levels over the past 50 years of government spending, taxes, and deficits. But it does at least offer some historical perspective. The CBO report, "The Budget and Economic Outlook: 2020 to 2030" (January 2020) gives a look at where the federal budget has been, and a defensible if probably understated look at where it's currently headed.
To me, one of the striking facts about the federal budget over the last half-century that you wouldn't necessarily guess from the political rhetoric is that it has been so stable. The figure shows federal taxes and spending as a share of GDP since 1970, and the projected out to 2030.

Federal taxes have averaged 17.4% of GDP during that time, and looking at the last 50 years, it's been fairly close to that level most of the time. It surges higher in the late 1970s, when inflation was pushing people into higher tax brackets (because tax brackets weren't yet adjusted for inflation). It surges higher in the late 1990s, with the boost from higher stock prices and capital gains in the dot-com economy. Taxes drop in the aftermath of the dot-com bust in the early 2000s, and drop when the economy slows in the Great Recession. Still, given all the economic and political changes from 1970 to 2020, and all the complaints about how federal taxes are becoming increasingly burdensome, it's striking to me that the federal tax take tended to grow over the long term pretty much in synch with the rest of the economy.
There is one discordant note for the stability of federal tax revenues over time, and it relates to the current tax take and the predictions for the next few years. The usual pattern is that federal tax revenues rise and are above-average during good economic times when incomes are growing, while federal tax revenues fall and are below-average during recessions when the economy shrinks. But in early 2020, the last recession ended more than a decade ago and unemployment rates are at their lowest in 50 years. The CBO projections use a default prediction of a steady-state economy for the next few years. Thus, one would expect federal taxes to be higher than the long-run average now and in the next few years, not below.
On the spending side, the continuity is again striking to me, given the complaints one years about how federal spending has either exploded in size or been slashed into austerity. The half-century average is 20.4% of GDP. Spending is higher in big recessions, like the early 1980s or the Great Recession, and it's lower during times of economic booms, like the 1990s. But given all the shifts in federal spending from 1970 to 2020--say, the fall in defense spending as a share of GDP, the creation of Medicare, and now the swelling retirements of the "baby boom" generation--the overall stability is remarkable.
Again, there is a mildly discordant note in the present. The current economy is healthy enough that it would seem more plausible for federal spending to be below it's long-run average, now and in the next few years, but instead it is already a little above it's long-run average, and headed higher.
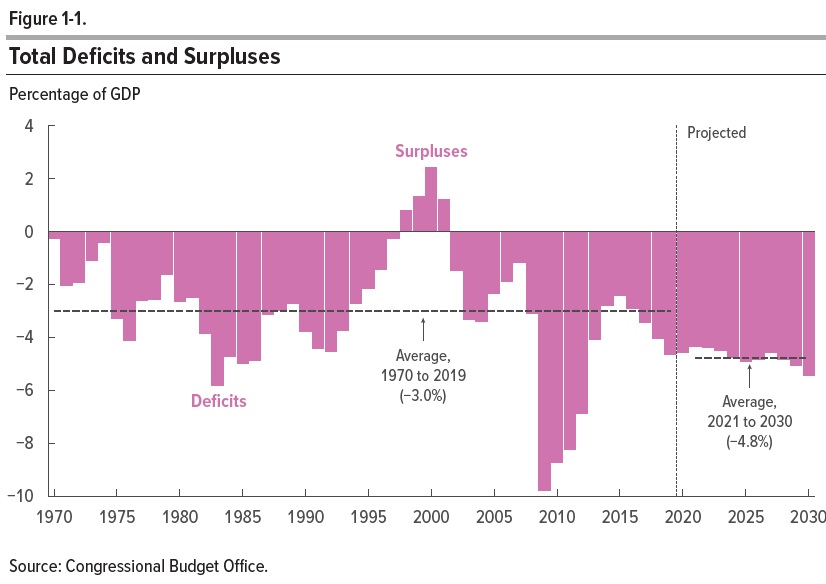
Putting together the tax and spending leads to budget deficits and surpluses. As the figure shows, the average US budget deficit over the last 50 years has been 3.0% of GDP. The projected deficits for the next decade average 4.8% of GDP--and remember, this is based on the assumption that the economy continues to grow without a recession and with continuing low unemployment (specifically, a rise to 4.4% later in the 2020s) continuing through the decade.
The CBO is constrained by law to make its predictions under the assumption that current legislation will take effect on time and on schedule, which means that its tax revenue estimates are prone to overstatement while its spending numbers are prone to understatement. For example, a big chunk of the predicted rise in tax revenues during the 2020s is that parts of the 2017 tax cut, under current law, expire in 2025. The law was designed that way, so that the long-term projected revenue loss would be limited. But whether those tax cuts are actually allowed to expire is a political decision, and I'm already hearing some noises about extending the tax cuts further.
On the spending side, the main reasons driving higher spending from 2020 to 2030 are related to rising costs for Social Security and for the major federal health care programs like Medicare, Medicaid, tax credits for health insurance, and the Children's Health Insurance Program are already large--given that several of these programs are spending more as the boomer generation retires--and projected to keep rising.
The other big area of rising federal spending is interest payments on past government borrowing. This graph shows the pattern of federal budget surpluses and deficits (as earlier) with the solid black line, but now the deficit/surplus is divided into the "primary" deficit, which doesn't include interest payments, and the interest payments are shown separately.
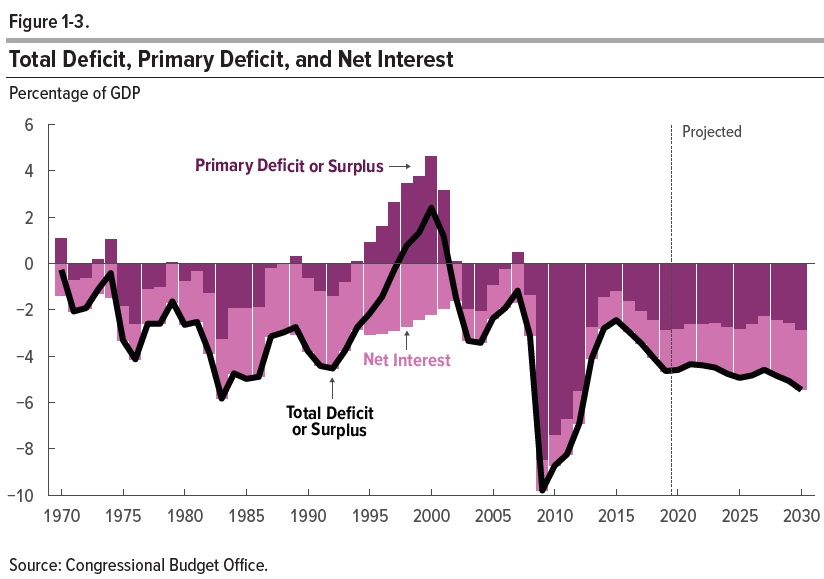
Net interest payments were 1.3% of GDP back in 2010, 1.7% of GDP in 2020, and projected for 2.6% of GDP in 2030. To put this in some perspective, the projected spending on interest payments in 2030 will be twice as much as the projected revenue from the corporate income tax in 2030, and slightly higher than projected Medicaid spending in 2030.
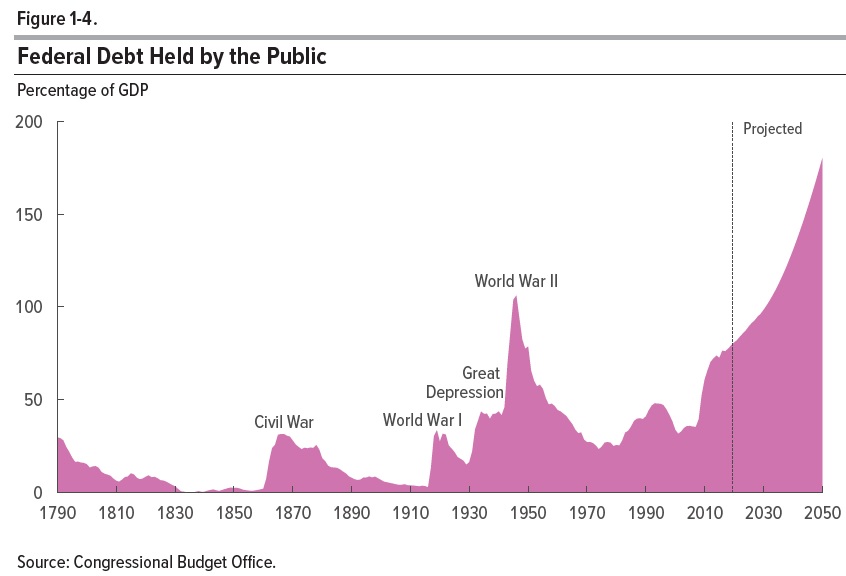
Looking at the projected deficits over time leads to projections for the accumulated federal debt. This graph extends to 2050. In 10 years, the projected federal debt (under the probably conservative CBO assumptions is 98% of GDP, roughly similar to the previous debt-to-GDP high at the end of World War II. The projected federal debt keeps rising after that, in part because higher interest payment feed on the higher debt, which in turn leads to still-higher interest payments.
There's no hard-and-fast rule as to when government debt becomes too heavy a burden or too severe a risk. The mighty US economy isn't Greece or Argentina, but neither is it invulnerable to the tradeoffs of needing to commit ever-additional resources to paying interest on past debt, or the risk that government borrowing may grow large enough that private-sector borrowing is crowded out, or that at some point in the next few decades, investing in US debt may look more risky than it appears today. At a minimum, it's undeniably true that annual US deficits as a share of GDP are projected to be well above their historical levels in the next decade, and the accumulation of US debt as a share of GDP, based on current law, is headed for uncharted territories.
Disclosure: None.


