
Where To Look For Cheap Stocks In 2015: CAPE Around The World
2014 was a lousy year for global value investors. Cheap markets, as measured by the cyclically-adjusted price/earnings ratio (“CAPE”) got even cheaper, while expensive markets got even pricier. (Note: the CAPE takes a ten-year average of earnings as a way of smoothing out the economic cycle and allowing for better comparisons over time.)
I expect this to reverse in 2015. At some point–and I’m betting it could be as early as the first quarter–global market valuations should start to revert to their long term averages. That’s fantastic news if you’re invested in cheap foreign markets. It’s not such fantastic news if your portfolio is exclusively invested in high-CAPE American stocks.
Let’s take a look at just how skewed the numbers are. The S&P 500 managed to produce total returns of 13.7% in 2014. But as quant guru Meb Faber pointed out in a recent blog post, globally, the median stock market posted a loss of 1.33%. The cheapest 25% of countries saw declines of 12.88%, while the most expensive markets actually gained 1.36%.
I should throw out a couple caveats here. These were the returns of U.S.-traded single-country ETFs, which are priced in dollars, and not the national benchmarks. The strength of the U.S. dollar relative to virtually every other world currency last year was a major contributor to the underperformance of the rest of the world.
All the same, it’s worth noting that we’re in uncharted territory here. As Faber noted in a recent tweet, U.S. stock valuations relative to foreign stock valuations closed 2014 at the highest spread over the past 30 years. Four out of the five biggest relative valuation gaps resulted in outperformance by foreign stocks the following year. The only exception was 2014.
Let’s dig into the numbers. The CAPE for the S&P 500 is now 27.2. That’s a full 63.9% higher than the historical average of 16.6, more expensive than at the 2007 peak, and close to the 1929 peak. The only time in U.S. history where the S&P 500 was significantly more expensive based on CAPE was during the peak of the 1990s tech bubble.

Sure, the “fair” CAPE is going to be a little higher today than in decades past due to record low bond yields (all else equal, lower yields mean higher “correct” valuations). But I should point out that yields are even lower in most of Europe and Japan, yet valuations are significantly cheaper. So while low bond yields might partially explain why U.S. stocks are expensive relative to their own history, it doesn’t explain why the U.S. is expensive relative to the rest of the world.
No matter how you slice it, U.S. stocks aren’t the bargain they were a few years ago. Research Affiliates calcuates that U.S. stocks are priced to deliver returns of about 0.7% over the next 10 years. Using a similar methodology, GuruFocus calculates an expected return of about 0.3%.
I’ve driven home how expensive U.S. stocks are. Now, let’s take a look at other global markets. Here are the world’s markets as measured by the CAPE and sister valuation metrics cyclically-adjusted price/dividend (“CAPD”) cyclically-adjusted price/cash flow (“CAPCF”) and cyclically-adjusted price/book (“CAPB”). All figures reported in Meb Faber’s Idea Farm using original data from Ned Davis Research.
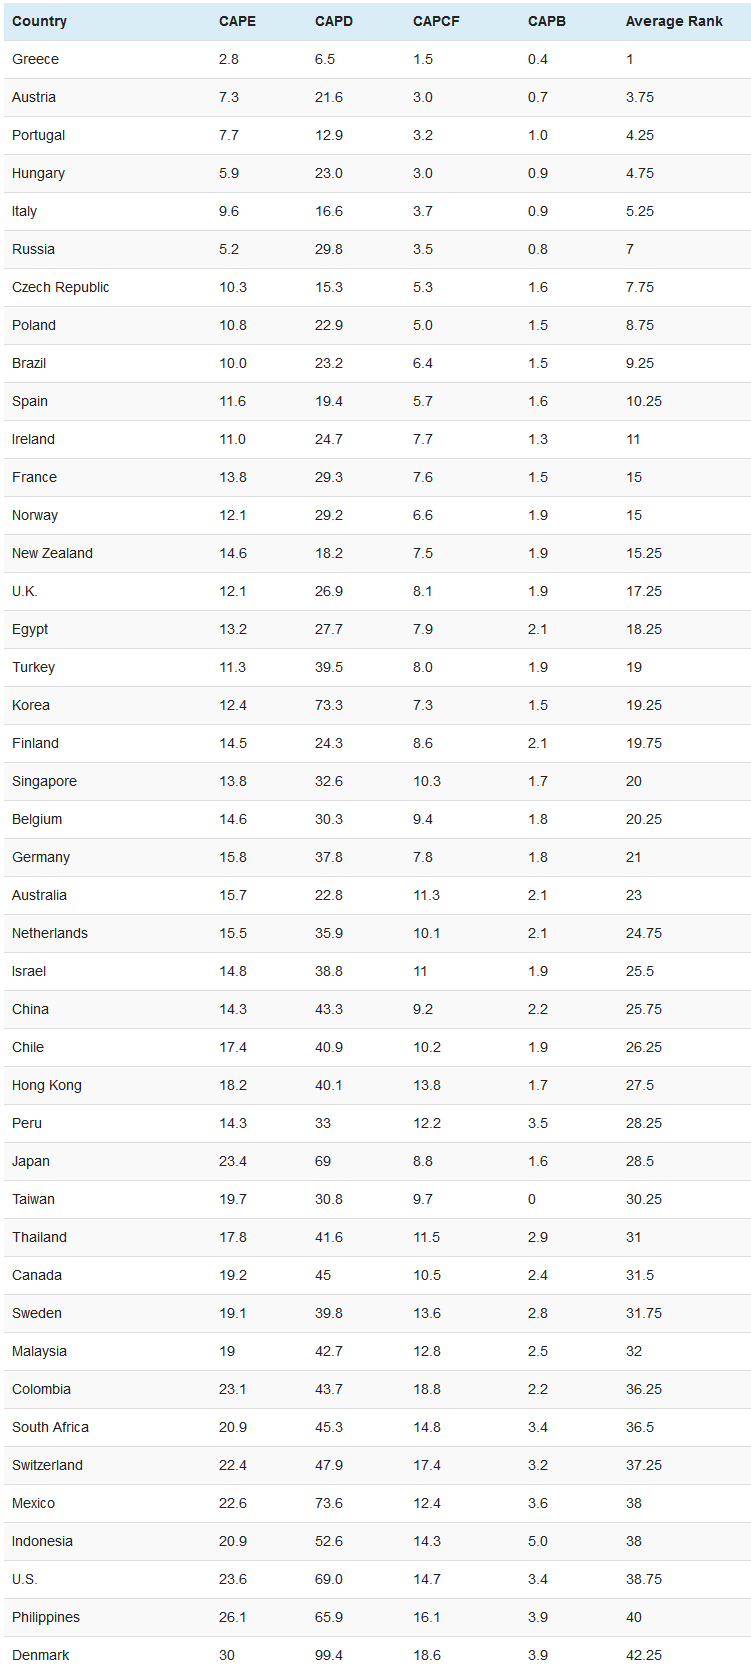
[Note: The U.S. figures use the MSCI U.S. index rather than the S&P 500, hence the difference in CAPE value.)
We see some familar names on the list. Greece remains the world’s cheapest market by a wide margin. Of course, Greece is also in the middle of an election cycle that may well result in the country getting booted out of the Eurozone. Interestingly, Russia is cheap following Western sanctions and the collapse in the price of oil, yet there are several far more stable countries that are cheaper, such as Austria, Portugal, Hungary and Italy.
Two countries that I’ve liked for years based on valuation–Brazil and Spain–round out the top ten. To put things in perspective, the most expensive market on this list–Spain–trades at nearly a 60% discount to the U.S. market based on CAPE. Yes, Spain has its problems. Its economy is stuck in a slow-growth rut, and unemployment remains over 20%. But Spain is also home to some of the world’s finest multinationals, such as banks BBVA (BBVA) and Banco Santander (SAN), telecom giant Telefonica (TEF) and fashion retailer Inditex (IDEXY).
There are different ways to use this data. You could buy and hold country ETFs, such as the Global X FTSE Greece 20 ETF (GREK), the Market Vectors Russia ETF (RSX) or the iShares MSCI Spain ETF (EWP). Or you could go with a convenient one-stop shop like Faber’s Cambria Global Value ETF (GVAL). GVAL is nice collection of cheap stocks from around the world. As of last quarter, GVAL’s largest country weightings were to Brazil, Spain and Israel.
Disclosure: Long GVAL, EWP, BBVA, SAN, TEF.
Charles Lewis Sizemore, CFA, is the chief investment officer of the ...
more

