
Where Next For The Three Sisters?
(Click on image to enlarge)
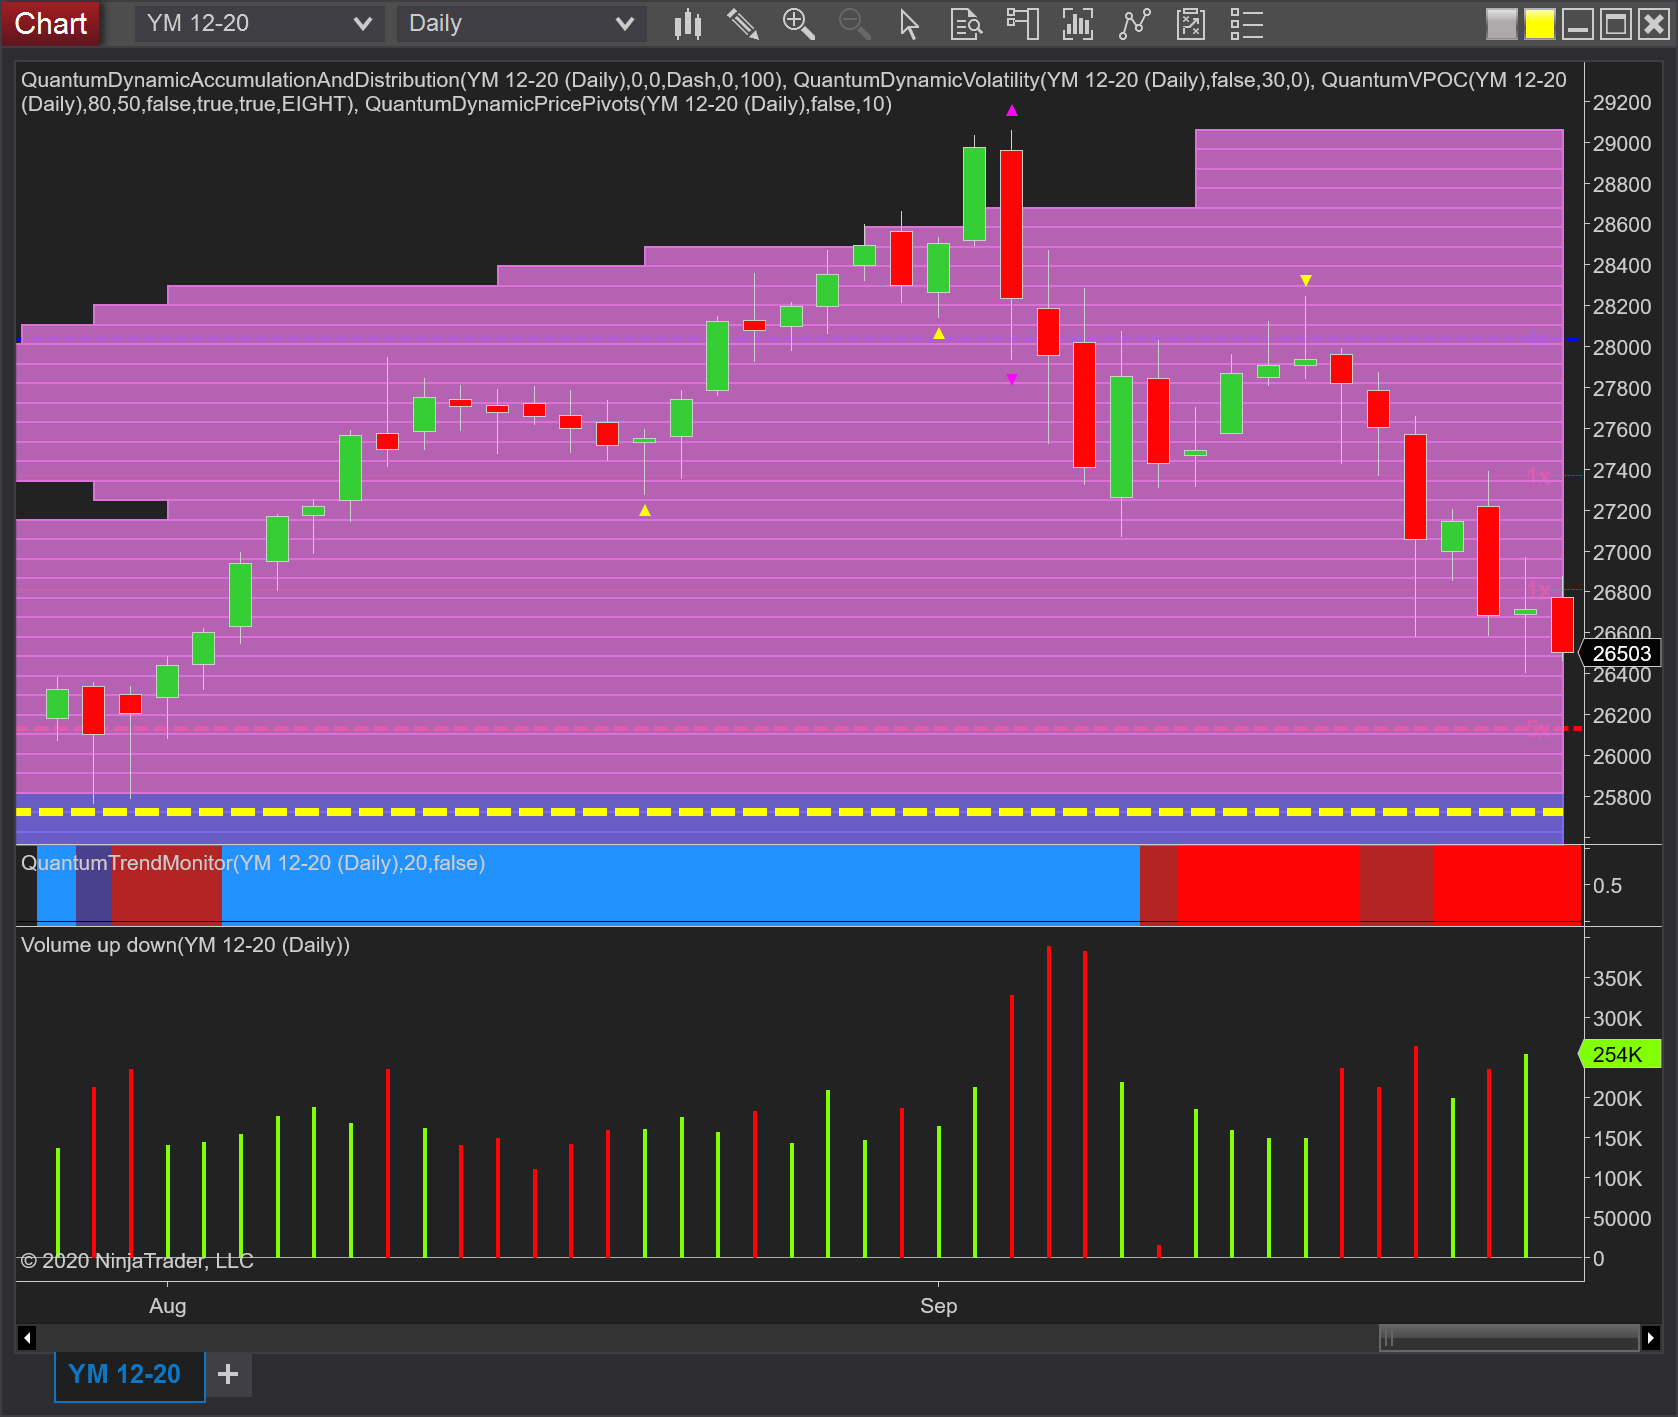
For investors wondering where the current bearish trend in US equities is likely to find some support, we need to consider the charts for the YM, the NQ, and the ES futures contracts and in particular the location of the volume point of control for each on the daily timeframe.
If we begin with the YM Emini, several things are clear. First, note the trend monitor indicator on NinjaTrader transitioned to red early in September confirming this change in sentiment clearly. Second, in terms of the volume point of control which is the yellow dashed line this is the fulcrum of the market and can not only be termed ‘fair value’ but also and denotes the heaviest concentration of transacted volume over time on the chart. It is, therefore, where we can expect a pause point and see a sustained period of congestion develop in the current bearish trend, and for the YM this is in the 25,700 region so some way to go for the Dow Jones from the current 26,540. So far, we have yet to see any sustained buying with the rally of mid- September looking extremely weak and confirmed with the heavy selling volumes which followed.
(Click on image to enlarge)
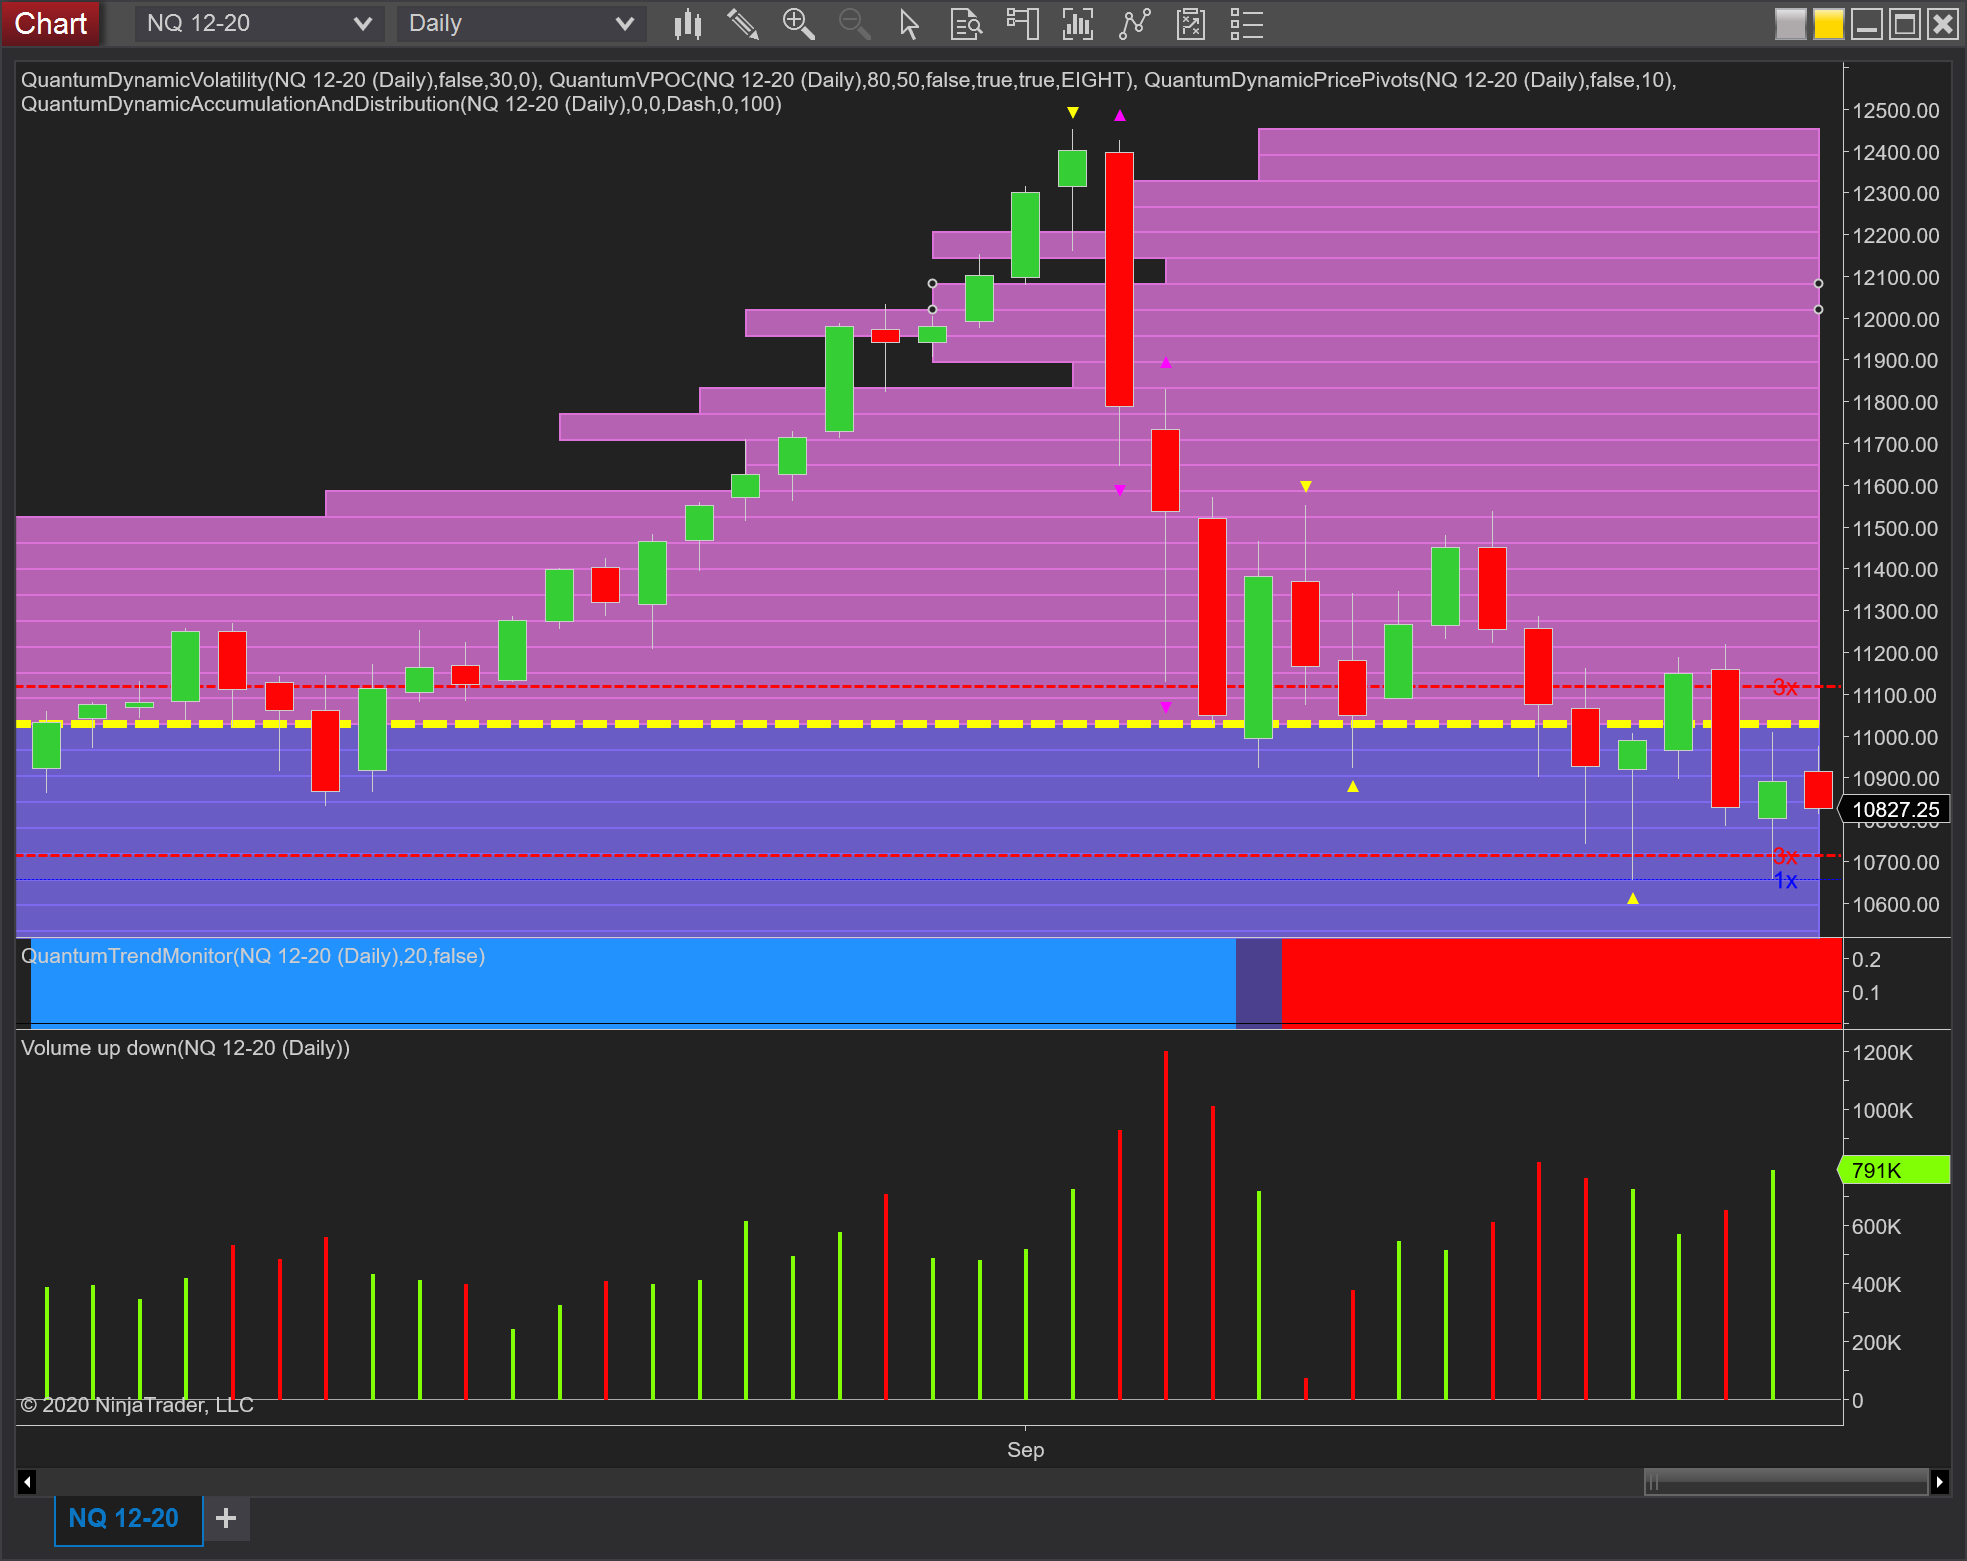
Moving to the NQ Emini in the same timeframe, this presents a slightly different picture. The volume point of control is already in evidence at 11,100 with the NQ currently trading at 10,828. Note too there is little in the way of any price based support below other than a minor level on the accumulation and distribution indicator and denoted with the red and blue dashed lines at 10,700 and below. Once again the trend monitor is bright red and confirming the outlook for this index.
(Click on image to enlarge)
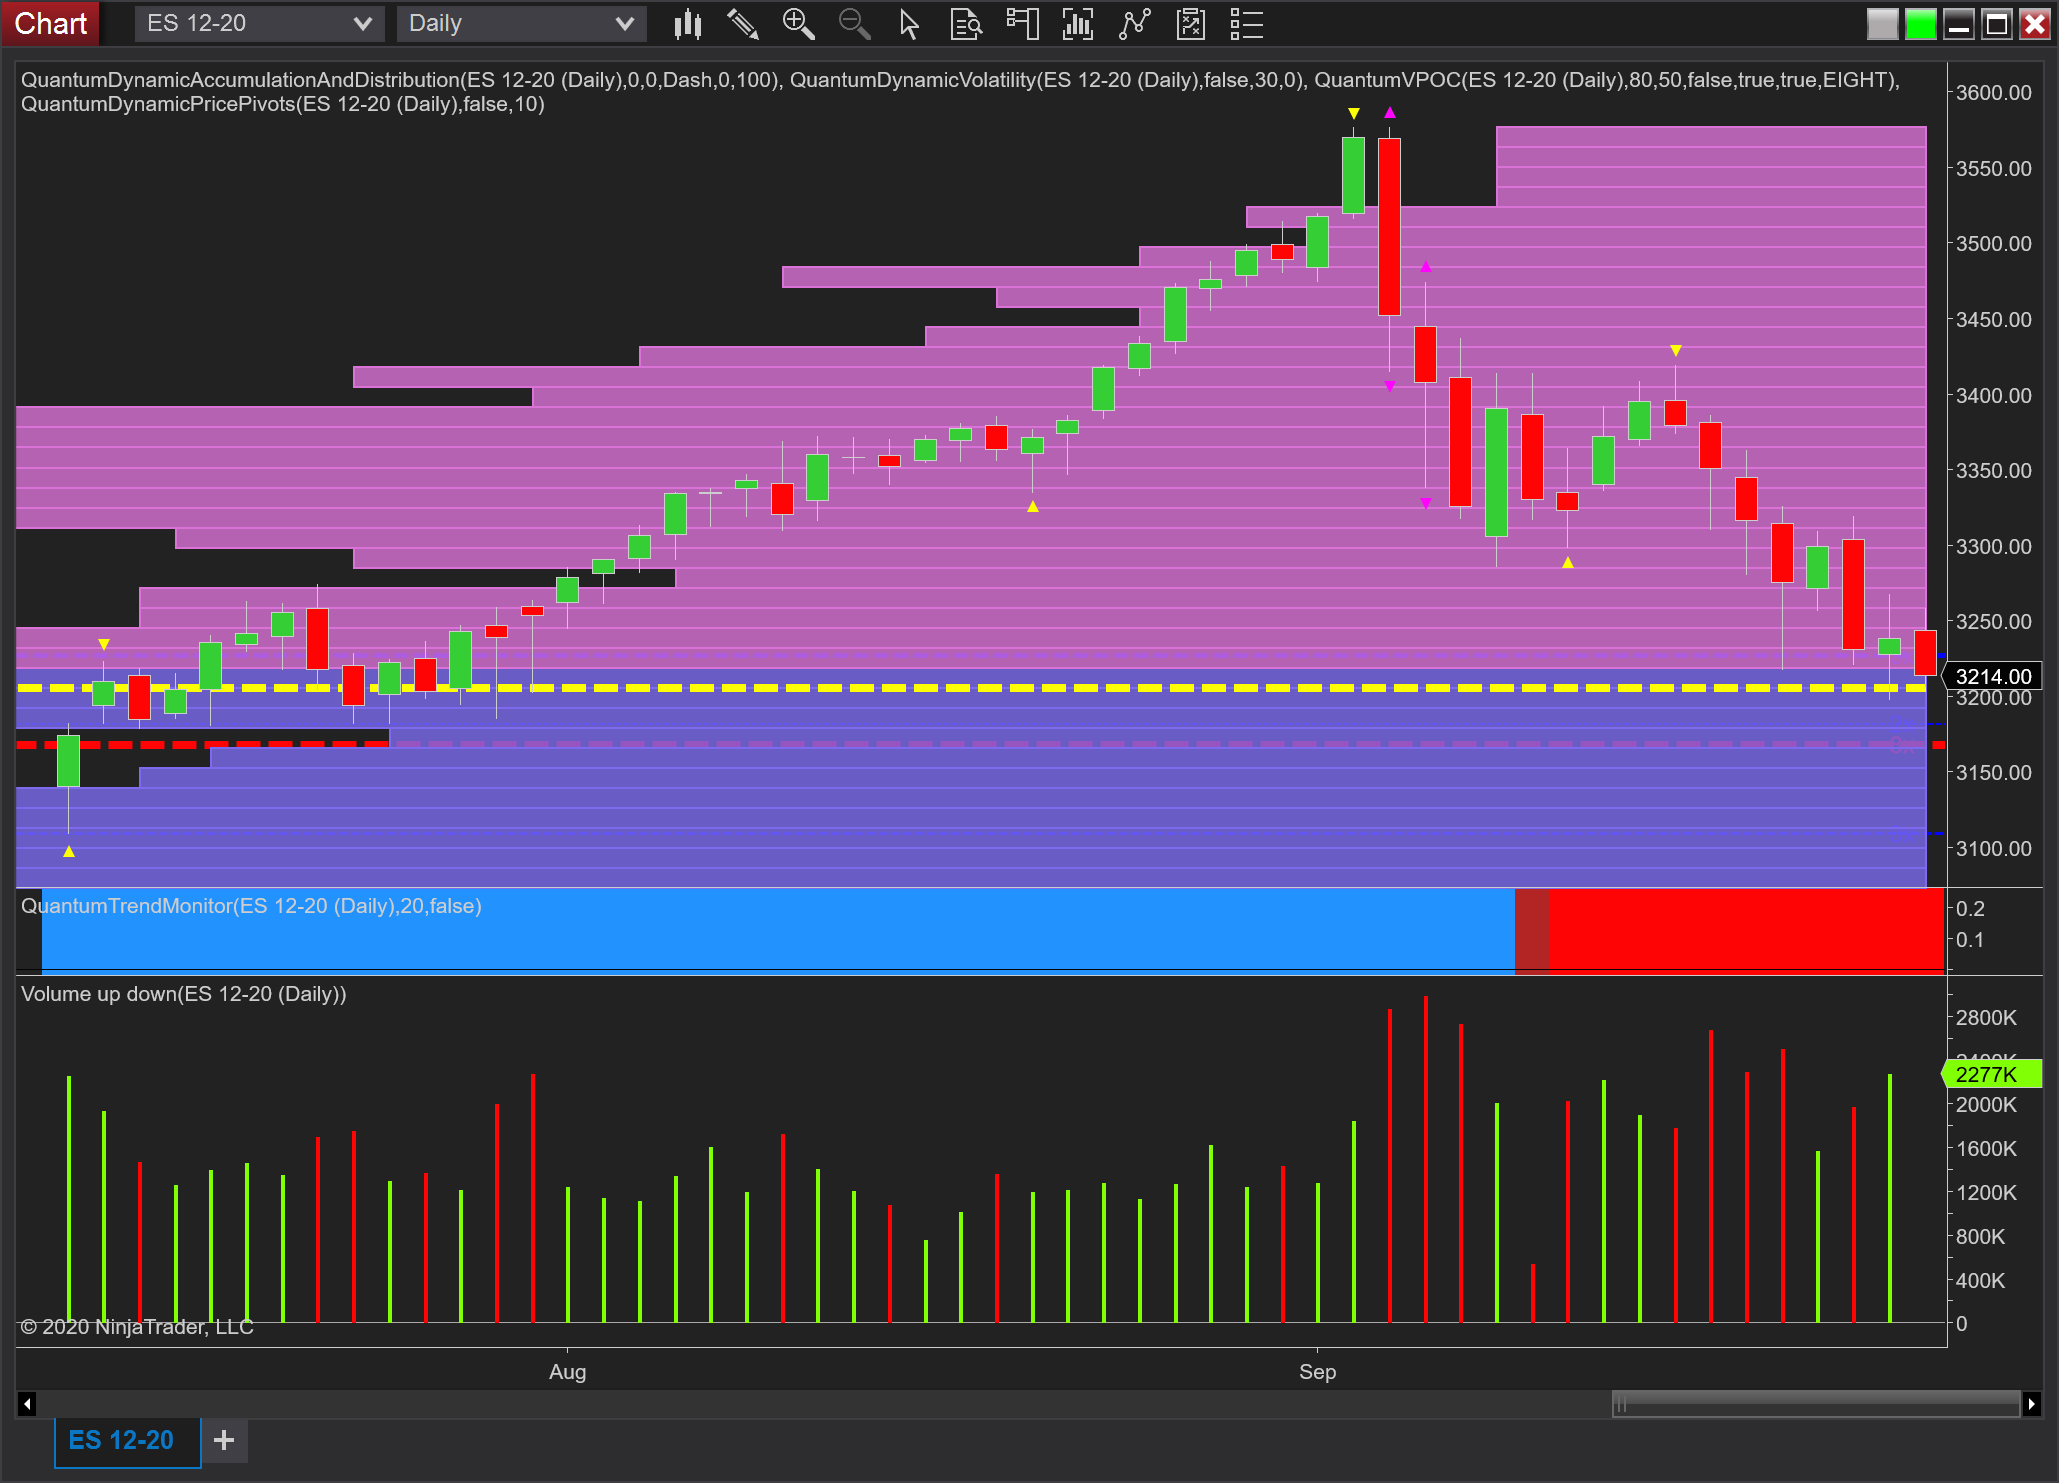
Finally to the ES Emini which at the time of writing is trading at 3212 and fast approaching the volume point of control immediately below. Again note the weak rally in mid September on falling volume thereby confirming the longer term picture for equities. Below the VPOC we have some stronger price based support in place at 3170.
Overall the outlook is extremely weak particularly for the Dow Jones YM Emini which looks set to shed a further 700 to 800 points before finding any meaningful support and joining its sisters in their current congestion phases. Longer term, once we see a break away from the VPOC on each chart, all three could move significantly lower before either volume or price based support then comes into effect. For the Dow this is around 24,300, for the NQ it is around 10,400 and for the ES 3,100.
Disclaimer: Futures, stocks, and spot currency trading have large potential rewards, but also large potential risk. You must be aware of the risks and be willing to accept them in order to invest in ...
more

