
Where Next For GBP/USD After The Surge? Polls, Data, And Trump Matter
- GBP/USD has surged to around 1.3050 as investors begin pricing in a Conservative victory.
- US data and further election developments may weigh.
- The daily chart allows for viewing the next levels.
Has Boris Johnson’s campaign already succeeded? Pound bulls seem to think so, pushing GBP/USD to 1.3063 – the highest levels since May.
While Labour is narrowing the gap against the Conservatives, the roughly ten-point gap may be insurmountable with only eight days to go. Some traders may already be pricing in the ratification of the Brexit accord and market-friendly policies that the Tories promise.
Johnson avoided having his picture taken with President Donald Trump – and that may have helped as well. The US president is considered toxic in the UK, especially after he previously called for opening the National Health Service (NHS). Trump has now changed tack – seemingly trying to support the PM. He said that even if the UK would hand the NHS on a silver platter, the US would reject it.
The focus is now on the NATO Summit which Johnson is hosting and that draws attention away from the elections. However, once world leaders leave Watford and new polls are released, sterling is set to react.
Surveys that show Jeremy Corbyn’s Labour Party catching up may weigh on the pound. Investors fear his murky Brexit path and radical left policies. If polls show stability, sterling may rise as markets prefer the certainty of the PM’s accord and the Conservatives‘ market-friendly policies.
Markit´s final Services Purchasing Managers’ Index for November came out at 49.3 points, better than 48.2 originally reported. That may have also had a positive effect on GBP/USD.
Trade headlines, US data
The market mood has improved after Bloomberg reported that the US and China are closer to a trade deal despite the intense rhetoric. Earlier, stocks were on the back foot amid reports that Washington is still keen on slapping tariffs on Beijing on December 15. Moreover, Trump stated that he may wait for after the November 2020 elections for striking a deal.
The president may continue making remarks throughout the day, setting the mood. Traders will also be tuned to critical US data. The ISM Non-Manufacturing PMI is set to show ongoing expansion in the services sector.
Earlier this week, the PMI for the manufacturing sector showed deeper contraction, sending the dollar lower.
ADP’s Employment Change figure is also of interest to markets, as it serves as a hint toward the all-important Non-Farm Payrolls on Friday. America’s largest payroll provider is forecast to show a faster gain in private-sector job growth.
Overall, a busy day awaits pound/dollar traders, amid the elections, trade, and US data.
GBP/USD Daily Chart – Significant breakout
(Click on image to enlarge)
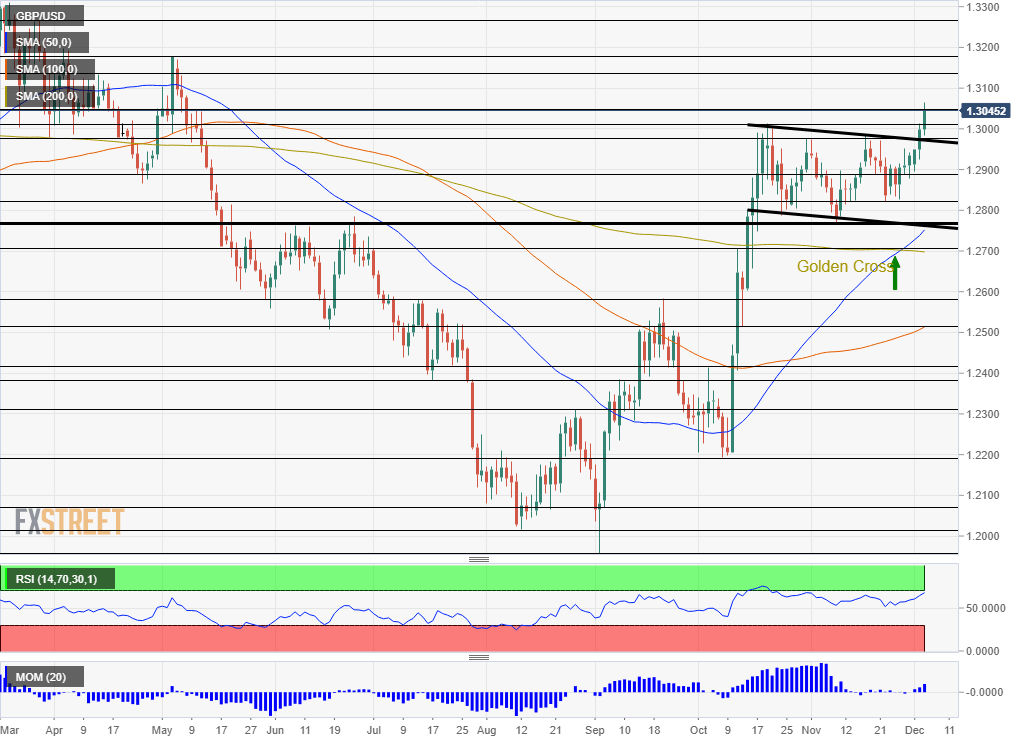
The broader daily chart comes into play and it shows a clear breakout above the downtrend channel. Cable is extending its gains after it enjoyed the Golden Cross pattern – the 50-day Simple Moving Average crossed the 200-day SMA.
Momentum is picking up and the Relative Strength Index is still below 70 – outside overbought conditions.
Resistance awaits at the daily high of 1.3063, and it is followed by 1.3135, which held sterling down in April. Next, we find the May peak of 1.3180. It is followed by 1.3275.
Support awaits at 1.3045, a high point in May. Next, we find 1.3013, which is October’s high, and then by the November peak of 1.2985. Lower, we find 1.2890, which held the pound down in November.
Disclaimer: Foreign exchange (Forex) trading carries a high level of risk and may not be suitable for all investors. The risk grows as the leverage is higher. Investment objectives, risk appetite and ...
more

