
Where Investors Put Their Money In 2018

For most investors, 2018 was both an eventful and frustrating year.
Between the looming threat of trade wars and growing geopolitical uncertainty, the market also skipped a beat. Volatility took center stage, and the S&P 500 finished in negative territory for the first time in 10 years.
Although many asset classes finished in negative territory, a look at fund flows – essentially where investors put their money – helps paint a more intricate picture of the year for investors.
VISUALIZING 2018 FUND FLOWS
Today’s infographic comes to us from New York Life Investments, and it visualizes the flows in and out of U.S. funds for 2018.
It not only shows when investors poured money into mutual funds or ETFs, but it also breaks down these funds by various categorizations. For example, when did people buy funds that held U.S. equities, and when did they buy funds that primarily held money market securities?
Let’s dive into the data, to take a deeper look.
MUTUAL FUNDS VS. ETFS
For another year in a row, ETFs gained ground on mutual funds:
(Click on image to enlarge)
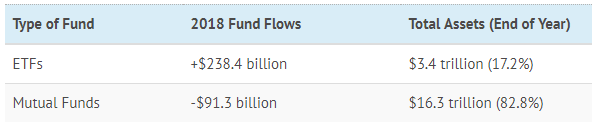
However, despite growing for another year, ETFs still make up a smaller part of the overall fund universe.
FLOWS BY ASSET CLASS GROUP
Every fund gets classified by Morningstar based on the types of assets it holds.
For example, a fund that focuses on holding fast-growing, large tech companies in the U.S. would be classified broadly as “U.S. Equity”, and more specifically as “U.S. Equity – Large Growth”.
Here’s how flows went, within these broader groups:
(Click on image to enlarge)
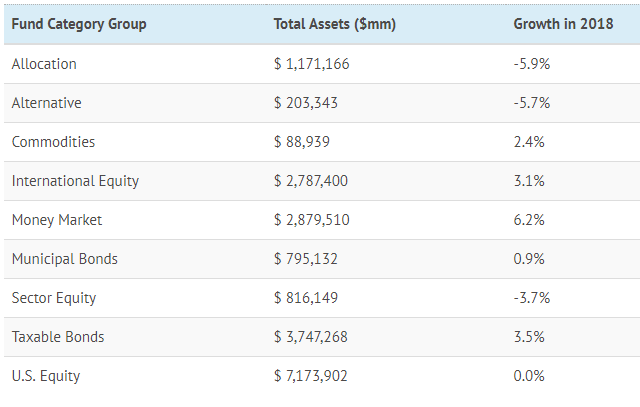
Investors pulled money from Allocation, Alternative, and Sector Equity funds while rotating into Money Market and Taxable Bonds categories. These latter assets are considered safer, and this shift is not surprising considering the market volatility towards the end of the year.
Also interesting here is that U.S. Equity – the biggest category overall by total assets – saw equal amounts of inflows and outflows, ending with a 0.0% change on the year.
U.S. EQUITY: A CLOSER LOOK
U.S. Equity ended the year with zero change, but it’s also the biggest and broadest category.
Let’s break it down further – first, we’ll look at what happened to flows by market capitalization (small, mid, and large cap stocks):
(Click on image to enlarge)
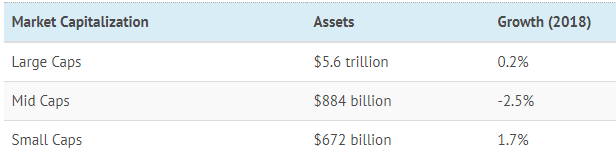
Investment in funds that held large-cap stocks increased by 0.2%, while the money allocated to small caps rose by 1.7% over 2018. Interestingly, investors pulled money out of mid-caps (-2.5%).
Now, let’s look at U.S. Equity by type of strategy:
(Click on image to enlarge)
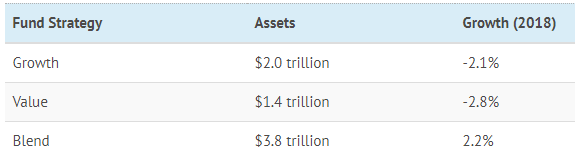
According to these flows, investors pulled money from funds focused solely on value or growth, while instead preferring funds that were a blend of the two strategies.
INTERNATIONAL EQUITIES
Finally, let’s see the types of international funds that investors bought and sold over 2018.
(Click on image to enlarge)
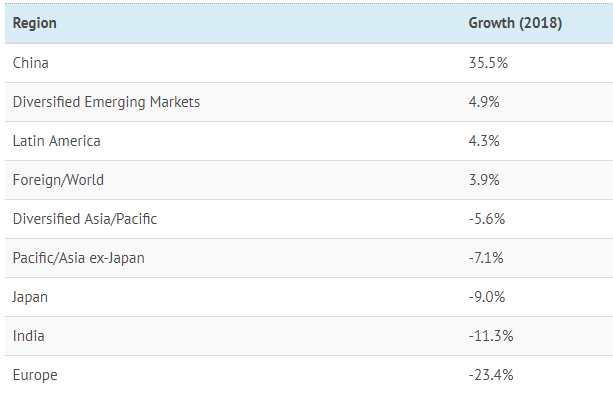
Investors eschewed funds that had a primary focus on European, Indian, and Japanese markets while piling into funds that held Chinese equities. Meanwhile, Latin America and emerging markets also got some love from investors.
CONCLUSION
While 2018 was an eventful year for markets, this recap shows that investors are adjusting their portfolios accordingly.
Where will investors put their money in 2019?
Disclosure: None


