
When Low-Vol Is Not
Equity investors might be forgiven for feeling a little whipsawed lately. After all, volatility in the S&P 500 pushed 18 percent over the last 12 months. In that time, a lot of money has flowed into low-volatility ETFs. Some $3.5 billion poured into the Invesco S&P 500 Low Volatility ETF (NYSE Arca: SPLV) alone, giving the 8-year-old fund a 23 percent share in an ever more crowded market segment.
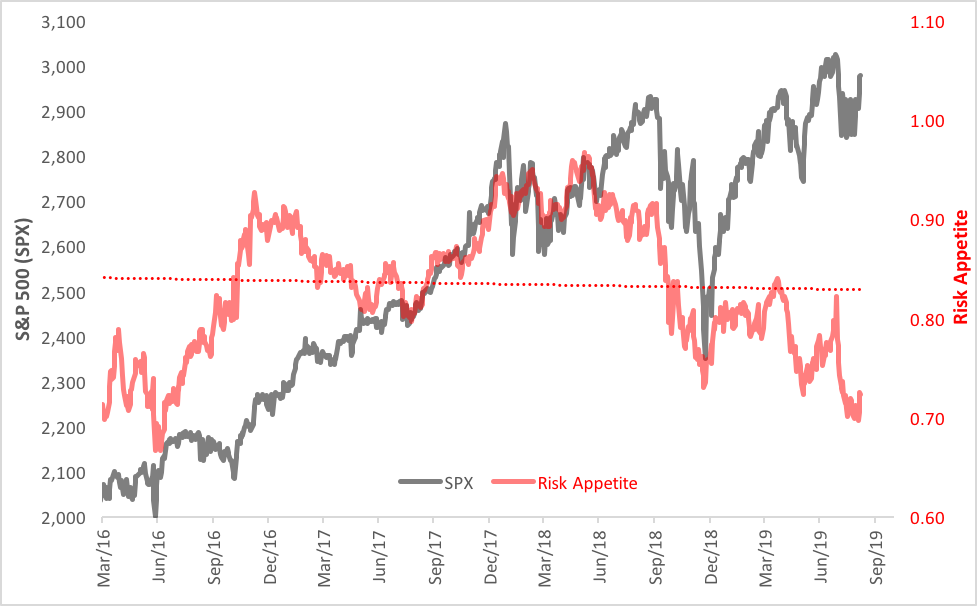
In Volatility’s Wake: The Market’s Appetite for Risk Is Waning
Not really surprising, that. SPLV has an enviable track record. Since its launch, SPLV has outperformed the SPDR S&P 500 ETF (NYSE Arca: SPY), the fund that’s the low-vol portfolio’s putative parent (SPLV’s portfolio is a winnowing of the S&P 500’s 100 least volatile stocks). On average, the annual gain realized by the SPLV fund is nearly a full percentage point higher than SPY’s. And, true to its moniker, the standard deviation in SPLV’s returns is nearly 25 percent lower, on average, than SPY’s.
But that word “average” hides a lot of detail. Telling detail. If we break down SPLV’s track record into discrete one-year spans, we see that SPLV’s standard deviation is not always lower than SPY’s. In fact, SPY beats SPLV in the low-vol derby nearly half the time. Three-eighths of the time, specifically.
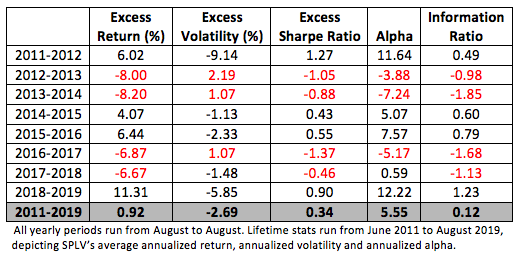
The table below details SPLV’s portfolio characteristics on a year-by-year basis versus SPY. Values in red denote underperformance by the low-vol portfolio. The fund’s lifetime numbers, shown in the grey row at the bottom of the table, are indeed impressive: a higher average annual return, lower volatility, and a resultant higher Sharpe ratio, along with a positive alpha coefficient and information ratio.
Within that time span, however, there’s a lot of, um, volatility in the numbers. In those years when SPLV’s standard deviation was higher than SPY’s, there was a cascading and deleterious effect on returns and other portfolio metrics.
SPLV’s Performance vs. SPY
So, what’s the point of all this? Simply put, capture of the low-volatility anomaly is path-dependent. Just because there’s a low-vol product available doesn’t mean you’ll always derive immediate benefit from its use. Look at the back-to-back underperformance in the 2012-2013 and 2013-2014 spans. Would you have been disappointed by SPLV back then? Would you have bailed from the low-vol strategy?
Many investors, in fact, did just that. Net outflows mounted in the 2013-2014 period and even spilled over into the subsequent period, just ahead of a couple of banner years. And in the 2016-2017 span, SPLV’s net outflows totaled $1.4 billion as the low-vol ETF significantly lagged SPY.
Clearly, the pursuit of a low-vol strategy requires a perspective on one’s investment horizon. Deriving a benefit may take more time than you think. In the long run, it pays to be patient.
Disclosure: None.


